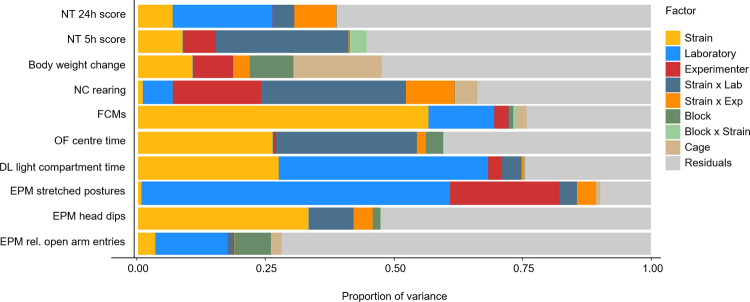
Fig 4. Proportion of variance explained by each factor.
For each outcome measure, the total variance of the full dataset could be decomposed into the following sources using an LMM: between-strain variability (yellow), between-laboratory variability (blue), between-experimenter variability (red), strain-by-laboratory interaction variability (dark blue), strain-by-experimenter interaction variability (orange), between-block variability (dark green), strain-by-block interaction variability (light green), between-cage variability (beige), and between-individual variability (residuals, grey). Shown are point estimates of the proportion of variation explained by each factor. For details on 95% confidence intervals of these estimates, see S7 Table. The raw data underlying this figure are available in the Figshare repository https://figshare.com/s/f327175aa8b541ef01bd. DL, Dark Light; EPM, Elevated Plus Maze; FCMs, faecal corticosterone metabolites; LMM, linear mixed model; NC, Novel Cage; NT, Nest; OF, Open Field.

