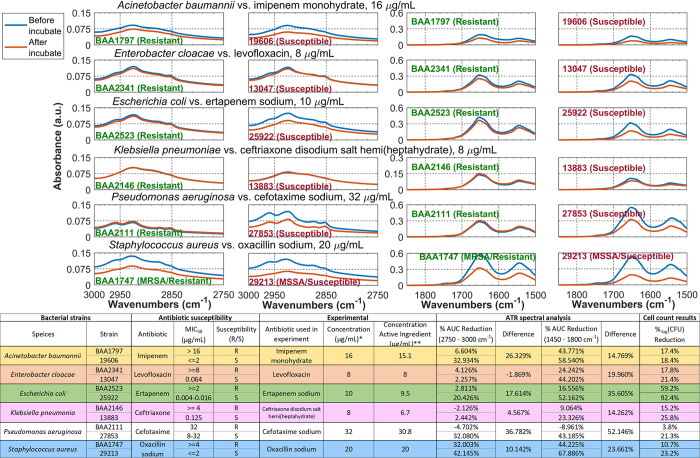
Fig 2.
(Top) Zoom-in view to the two highlighted regions in each strain from Fig 1 to show the common spectral change trend between MDR and antimicrobial-susceptible strains in six species. (Bottom) Table summary (1) Strain designation, antimicrobial susceptibility to six different antimicrobials, MIC50 values and the sources for the MIC50 values. (2) Reagent used in experiment and the concentration of active ingredient. * All antimicrobial solution is prepared in 5% dextrose saline. **Estimated concentration of antimicrobial in the prepared solution. (3) Area Under the Curve (AUC) calculation for each spectrum. (4) # of viable colonies determined by quantitative overnight culture for each strain, before and after antimicrobial incubation.

