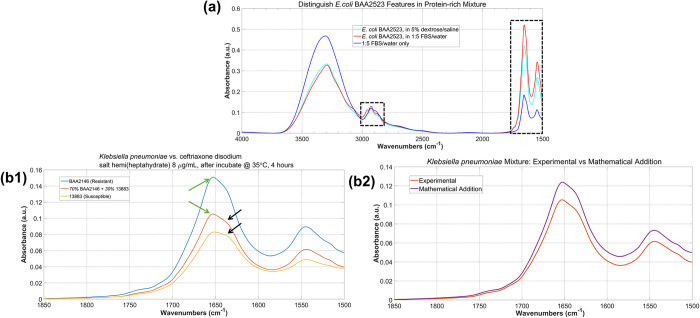
Fig 3. Selectivity of the ATR system.
(a) averaged ATR spectra of E. coli BAA2523 in (cyan) 5% dextrose saline and in (red) FBS/water 1:5 mixture. The spectra of the FBS/water 1:5 mixture itself is shown in Blue. The two black rectangular boxes highlight two spectral regions where clear spectral differences can be seen. (b1) ATR spectra of K. pneumoniae BAA2146 (MDR), K. pneumoniae 13883 (susceptible) and a mixture of 60% BAA2146 and 40% 13883. Zoom-in view to the Amide I–Amide II spectral region (1500–1850 cm-1). # of viable cells in all three are in the 107 cfu/mL range. (b2) Contributions from BAA2146 and 13883 are clear in the mixture spectrum, marked by similarity between the experimental spectrum and the mathematical addition of the BAA2146 and 13883.

