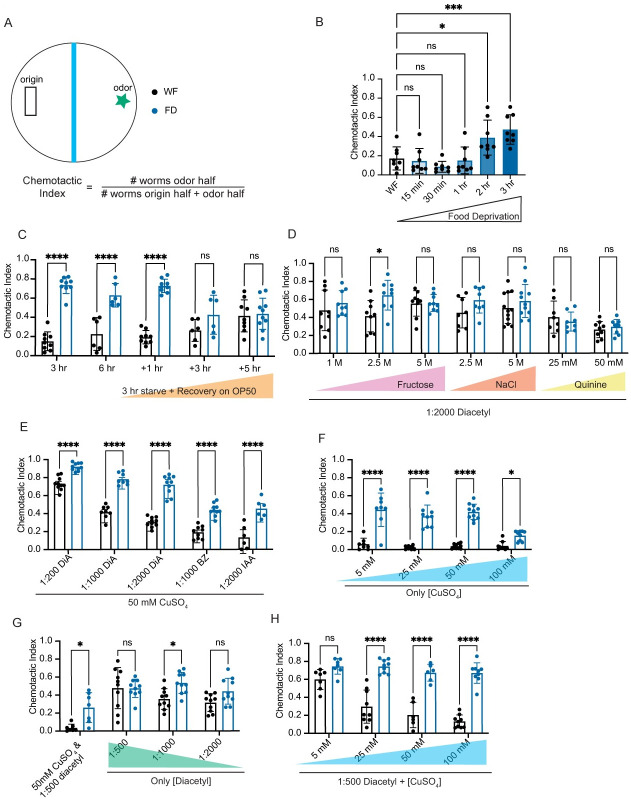
Fig 1. Starvation reduces copper avoidance.
A) Schematic of the sensory integration assay. ~100–200 day 1 adult animals (n) are placed in the black rectangle. Blue barrier represents copper barrier (or other repellant) and star represents diacetyl or other attractant. Chemotactic Index is the number of animals that have crossed the barrier (odor side) divided by the total number of animals on the plate (odor + origin sides). Experiments with well-fed (WF) animals will appear with black dots and those with food-deprived (FD) animals will be indicated with blue dots. Unless otherwise noted, FD is 3 hrs with no food. Each dot represents a single plate (N) of animals (n). B) Animals are deprived of food for increasing periods of time (15 mins, 30 mins, 2 hrs, 3 hrs). Animals are exposed to 50 mM CuSO4 repellant and 1:500 (0.2%) diacetyl attractant. N = 8. C) Sensory integration behaviors of animals that have been starved for 3 hrs and 6 hrs. Animals that have been starved for 3 hours are allowed to recover for 1, 3, or 5 hrs on OP50. Well-fed matched partners are kept on OP50 plates for the entire length of the experiment. Animals are exposed to 50 mM CuSO4 repellant and 1:500 (0.2%) diacetyl attractant. N≥6. D) Animals are exposed to increasing concentrations of other repellants (Fructose, NaCl, Quinine) with the attractant 0.05% diacetyl (1:2000) in each condition N≥7. E) Animals are exposed to decreasing concentrations of diacetyl (DiA) (0.2%, 0.1% and 0.05%, or 1:200, 1:1000, and 1:2000, respectively) and other volatile attractants 0.1% Benzaldehyde (BZ) and 0.05% Isoamyl Alcohol (IAA). 50 mM CuSO4 is the repellant in each condition N≥6. F) Animals are exposed to CuSO4 in increasing concentrations (5 mM, 25 mM, 50 mM, 100 mM) without any attractant N≥8. G) Animals are exposed to diacetyl alone in decreasing concentrations (0.2%, 0.1%, 0.05%). Full assay (0.2% diacetyl and 50 mM CuSO4) is included as a control N≥7. H) Animals are exposed to 1:500 diacetyl and increasing concentrations of CuSO4 (5 mM, 25 mM, 50 mM, 100 mM) N≥6. All graphs are analyzed using a two-way ANOVA, determined to have significant differences across well-fed and food-deprived conditions. WF/FD comparisons were then performed as pairwise comparisons within each genotype or treatment as t-tests with Bonferroni corrections for multiple comparisons. * p<0.5, ** p<0.01, *** p<0.001, **** p<0.0001, ns p>0.05. Error bars are S.D.

