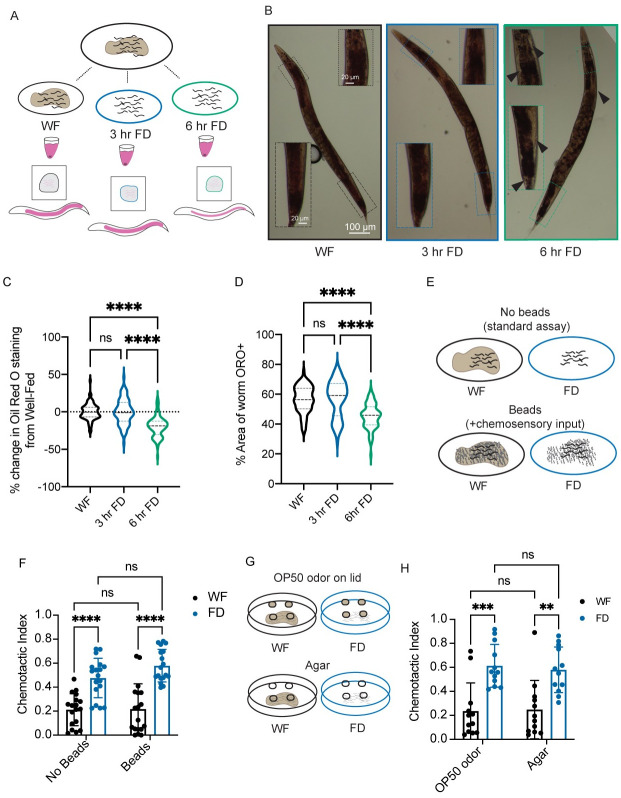
Fig 3. Lack of food, not fat or physical interactions, drive behavioral changes.
(A) Schematic of Oil Red O experiments. Animals are raised together to day 1 of adulthood and separated into three groups: well-fed (on food), 3 hr food-deprived, and 6 hr food-deprived. Animals are stained using Oil Red O and then imaged using a color camera. (B) Representative images of well-fed (WF, black), 3 hour food-deprived (3hr FD, blue), and 6 hr food-deprived (6 hr FD, green). Inset images are shown, highlighting the regions where there is the most difference in staining. Black arrows highlight regions of no Oil Red O stain in 6 hr FD. (C) Graph showing the percent change in Oil Red O staining when compared to the average of the area of Oil Red O signal above a threshold value in the well-fed group within each independent experiment. N = 3, n>20 within each experimental treatment group. (D) Graph showing the percent of the animals’ area that contains Oil Red O signal above threshold N = 3, n>20 within each experimental treatment group. Same data as in C, shown as non-normalized values. (E) A schematic representing the experiment in F, in which populations of animals are either well-fed or food-deprived in the presence or absence of Sephadex beads before performing the sensory integration assay. (F) Prior to the sensory integration assay, animals are exposed to either standard OP50 (“no beads WF”) or empty plates (“no beads FD”), or Sephadex gel beads as chemosensory input. Alternatively, animals were exposed to beads and no food (“beads FD”) or OP50 with Sephadex beads on top (“beads WF”) for 3 hours. Animals were then exposed to standard Sensory Integration Assay set-up with 50 mM CuSO4 and 1 μl of 0.2% diacetyl. N≥18. (G) A schematic representing the experiment in H, in which populations of animals are either well-fed or food-deprived in the presence of OP50-containing agar plugs on the lid of the plate or agar alone plugs on the lid of the plate before performing the sensory integration assay. (H) Prior to the sensory integration assay, animals are exposed to either standard OP50 empty plates, covered with lids containing either agar plugs (agar) or agar plugs with OP50 lawns (OP50 odor) as a chemosensory input for 3 hours. Animals were then exposed to standard Sensory Integration Assay set-up with 50 mM CuSO4 and 1 μl of 0.2% diacetyl. N = 12 per condition. C and D were analyzed using Welch’s ANOVA test with Dunnett’s multiple comparisons test. * p<0.5, ** p<0.01, *** p<0.001, **** p<0.0001, ns p>0.05. F and G were analyzed using a full model two-way ANOVA, determined to have significant differences across well-fed and food-deprived conditions but no difference between “bead”/“no bead” groups or “odor”/”agar” groups. Those comparisons are shown to indicate no difference between “beads” and “no beads”. Pairwise comparisons within each treatment were performed as t-tests with Tukey’s multiple comparisons test. Error bars are S.D.

