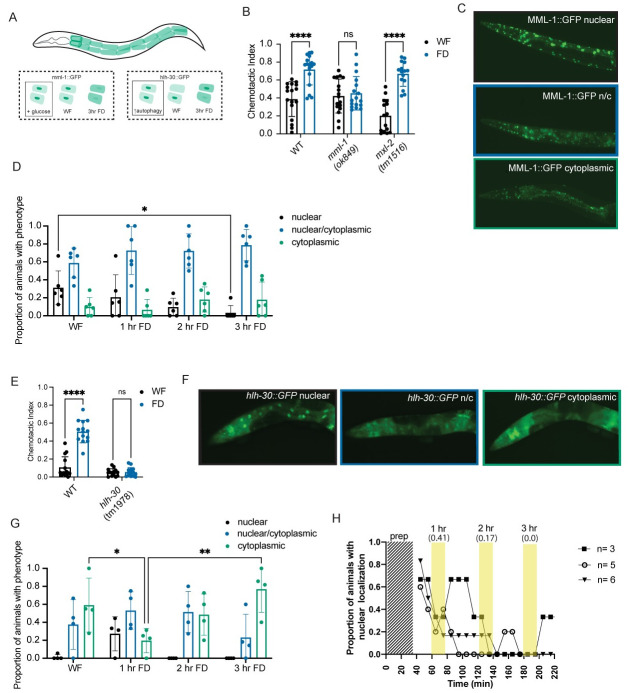
Fig 4. mml-1 and hlh-30 are required for sensory integration change upon food deprivation, correlated with shifts in their intestinal localization.
(A) Schematic showing the 20 intestinal cells in a day 1 adult C. elegans. Our findings for mml-1::gfp and hlh-30::gfp transgenic animals are shown in the dotted box, while previously published paradigms are within the solid line box. Addition of glucose has been shown to induce nuclear localization of MondoA. Autophagy has been shown to increase nuclear localization of HLH-30. (B) Standard sensory integration assay with mml-1(ok849) and mxl-2(tm1516) and wildtype controls. N = 20. (C) Representative images of MML-1::GFP localization in day 1 adult animals (data quantified in D). All images were collected with the same exposure time and laser power. (D) Intestinal MML-1::GFP expression in animals during static timepoints food deprivation. Only intestinal expression was characterized as “nuclear”, “nuclear/cytoplasmic”, or “cytoplasmic”. Each dot represents the proportion of animals within an experiment with the phenotype. N = 6, n = 296.(E) Standard sensory integration assay with hlh-30(tm1978) mutant animals and wildtype controls. N = 9. (F) Representative images of HLH-30::GFP localization in day 1 adult animals (data quantified in G). All images were collected with the same exposure time and laser power. (G) Intestinal HLH-30::GFP expression in animals during static timepoints of food deprivation. Only intestinal expression was characterized as “nuclear”, “nuclear/cytoplasmic”, or “cytoplasmic”. Each dot represents the proportion of animals within an experiment with the phenotype. N = 3, n = 149. (H) Intestinal HLH-30::GFP expression in animals during time lapse imaging. The proportion of animals (n = 3, n = 5, n = 6) with nuclear localization are plotted over time, with images taken every 10 minutes. The areas shaded in yellow correspond to the timepoints that match those in the separate experiments in Fig 4G, with the average of the timepoints within that period of time in parentheses. The shaded region labeled “prep” denotes time that the animals are off food but cannot be imaged due to preparation constraints. B and E were analyzed using two-way ANOVA, determined to have significant differences across well-fed and food-deprived conditions. WF/FD comparisons were then performed as pairwise comparisons within each genotype or treatment as t-tests with Bonferroni’s multiple comparisons test. D and G were analyzed using Two-Way ANOVA, determined to have significant differences across localization and an interaction between time of food deprivation and localization. Within each localization group, pairwise comparisons were performed across each time point and tested for significance using Tukey’s multiple comparisons test. * p<0.5, ** p<0.01, *** p<0.001, **** p<0.0001, ns p>0.05. Error bars are S.D.

