
FIGURE 3.
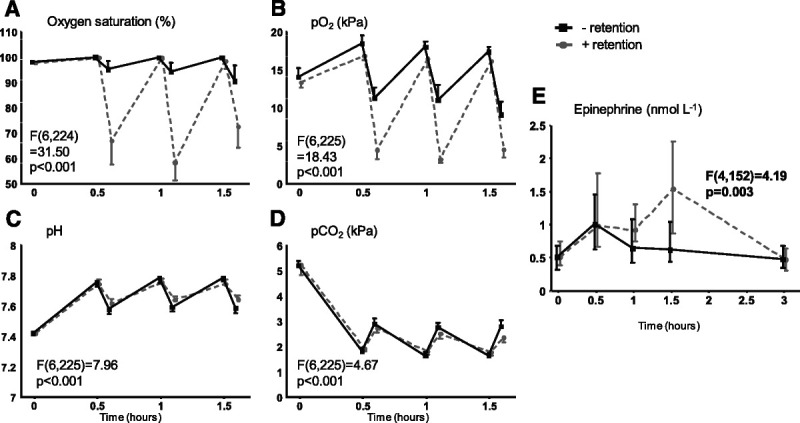
Arterial blood gas parameters and plasma epinephrine levels during the breathing exercises study: influence of breathing exercise. A, Oxygen saturation. B, Oxygen partial pressure (po2). C, pH. D, Carbon dioxide partial pressure (pco2). − retention: data obtained during the first breathing exercise on the experiment day (breathing exercise 1, Figure 1) from participants performing the breathing exercise without prolonged retention of breath. + retention: data obtained during the first breathing exercise on the experiment day (breathing exercise 1, Figure 1) from participants performing the breathing exercise with prolonged retention of breath. Data are presented as mean ± 95% confidence interval (panels A–D) or median and interquartile range (panel E) of 20 participants per group, and p values depicted in the graphs represent the between-group comparison calculated using linear mixed-models analysis (time by column factor). Epinephrine data were log-transformed before analysis. For comparisons that yielded time by column factor p values <.05, results of post hoc analyses performed using the Sidak multiple comparison test are reported in Table S1, http://links.lww.com/PSYMED/A820.