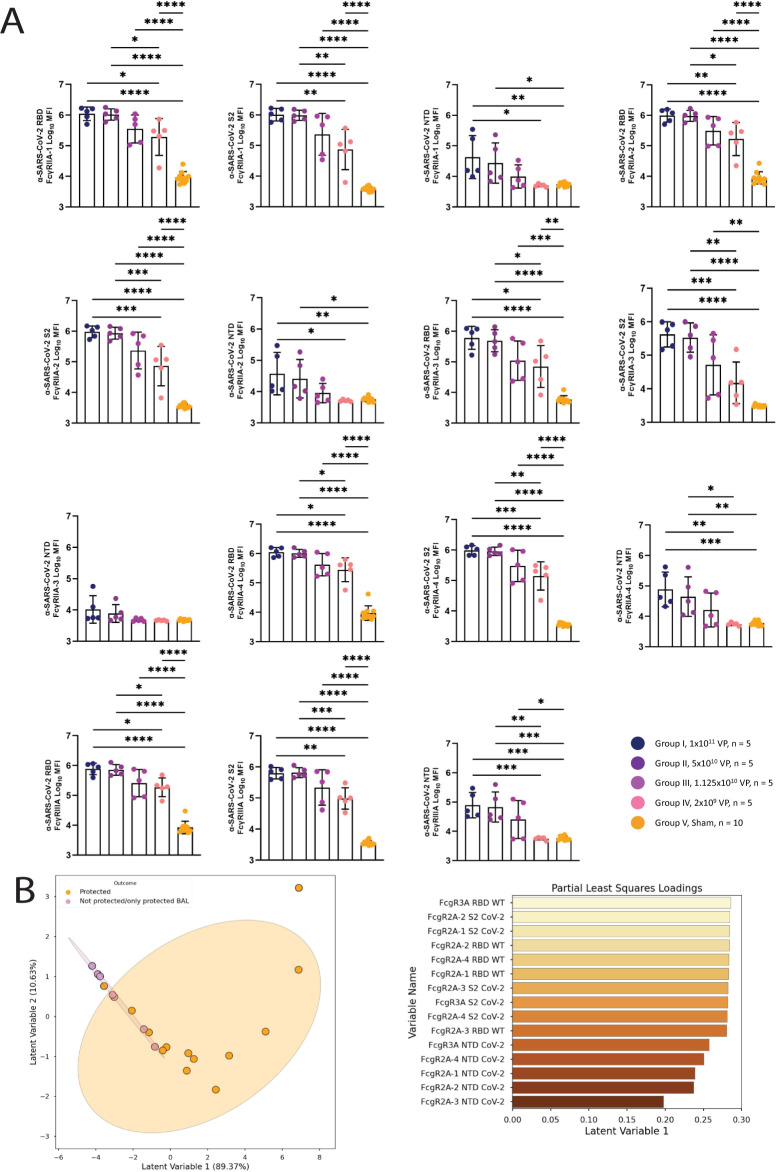
Fig 5. Comparison of FcγR binding profiles across SARS-CoV-2 spike domains.
(A) The titer of anti–SARS-CoV-2 RBD, S2 spike subunit, and NTD spike subunit antibody binding to FcγRIIA-1, FcγRIIA-2, FcγRIIA-3, FcγRIIA-4, and FcγRIII were profiled using Luminex. (B) Scores plot (upper plot) and loadings along the first latent variable (lower plot) for a PLS-R model, regressing on the AUC of viral load as measured by BAL over a 10-day time course. Each point represents an NHP, either completely protected (orange) or lacking complete protection (purple); ellipses correspond to the 95% confidence intervals for each group. Fig 5A data can be found in the file “data/figure5_data.csv.” Fig 5B can be generated using the data and code deposited in the “src” folder of https://github.com/dzhu8/Ad26-Dose-Down. Instructions to do so can be found in the README file. AUC, area under the curve; BAL, bronchoalveolar lavage; NHP, nonhuman primate; NTD, N-terminal domain; PLS-R, partial least square regression; RBD, receptor-binding domain; SARS-CoV-2, Severe Acute Respiratory Syndrome Coronavirus 2.

