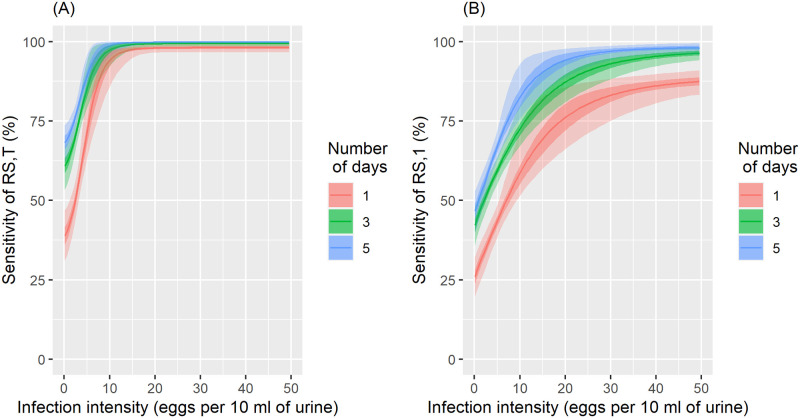
Fig 3. Sensitivity of a reagent strip (RS) in relation to infection intensity for measurements from a single to a total of 3 and 5 cumulative tests.
Trace results were included in the positives (A) and trace results were included in the negatives (B). Dark shaded areas are the 50% and light shaded areas the 95% Bayesian credible interval.

