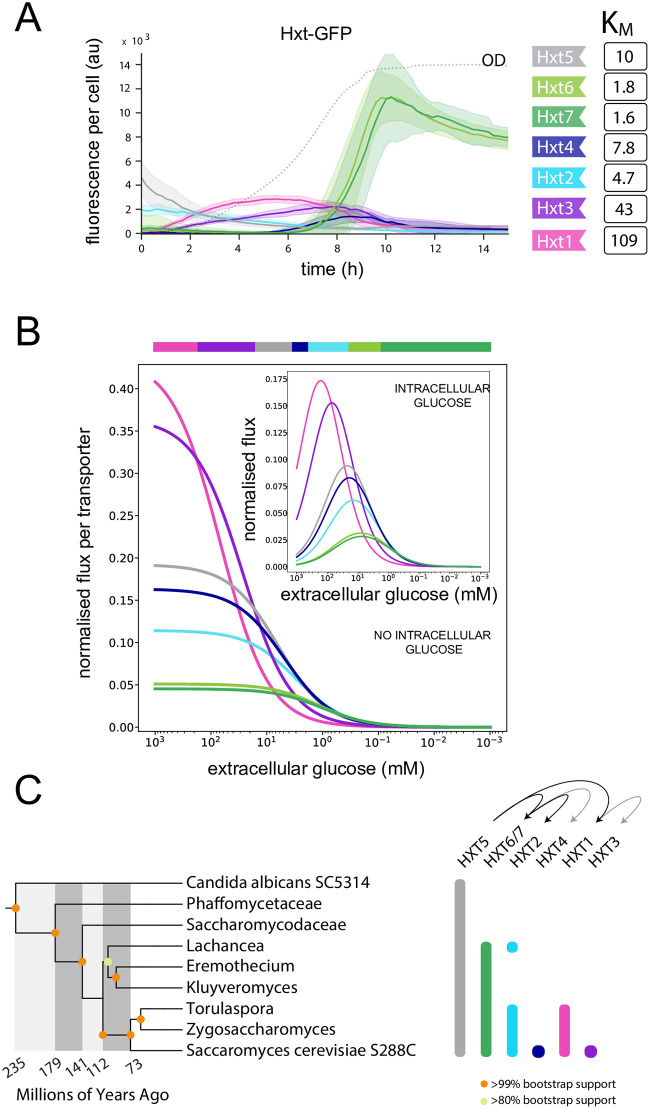
Fig 2. Regulation of yeast’s hexose transporters is broadly consistent with transport having a rate-affinity tradeoff.
A. As glucose falls, the different HXTs are expressed in an order approximately determined by their KM. We follow transporters tagged with GFP in batch culture with initially 2% (110 mM) glucose and show the mean fluorescence per cell. The concentration of glucose falls as the culture’s optical density (OD) increases (dotted line) and is near zero when the OD plateaus. The shaded regions indicate 95% confidence intervals found using bootstrapping over five replicate experiments. B. Using the apparent KM and assuming that cells optimise import, we can predict the order of expression of the HXTs in falling glucose. The main panel shows predicted import fluxes when intracellular glucose is zero, with the upper bar indicating which transporter has the highest flux. For the inset, the concentration of intracellular glucose is proportional to extracellular glucose (set at 20%), but the order of the optimal transporters in falling glucose is unchanged (compare the maximal flux in the inset to the upper bar). Fluxes are normalised by r = 104 s; fe is at the diffusion limit of 106 mM−1 s−1 [12]; fr = fe/103. C. A phylogenetic analysis suggests that the newly duplicated HXT genes evolved affinities for novel ranges of glucose concentrations. We show the phylogenetic tree based on 11 orthologous proteins for nine species of yeast. For each HXT gene, the vertical bars show those species whose genome encodes that gene. HXT5 is likely the ancestor of all the HXTs because it is the only one present in all nine species. The arrows show the likely origins of duplications. Based on the apparent affinities in S. cerevisiae, HXT5, with medium affinity, gave rise to the high affinity HXT6/7 and to the low affinity HXT1. High affinity HXT6/7 gave rise to the medium affinity HXT2 and HXT4. Very low affinity HXT1 gave rise to the low affinity HXT3.

