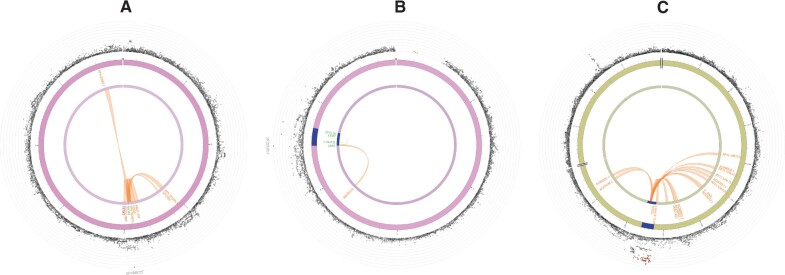
Figure 3.
Circos plots for the genome-wide significant loci for inverse normally transformed AMH in women. Circos plots are presented for each of the identified loci: MCM8 (A), AMH (B), TEX41 and CDCA7 (C). The outer layer represents the Manhattan plot. The second (including genomic positions) and third layers represent the chromosome ring; genomic risk loci are depicted in blue. Only genes mapped by either eQTLs or chromatin mapping are plotted. Genes only mapped by eQTLs are green; genes only mapped by chromatin interactions are orange; and genes mapped by both have a red colour. Orange-coloured lines represent chromatin interactions, green-coloured lines are eQTL links. Plots were created using the FUMA platform (Watanabe et al., 2017). AMH, anti-Müllerian hormone; FUMA, Functional Mapping and Annotation of Genome-wide Association Studies.

