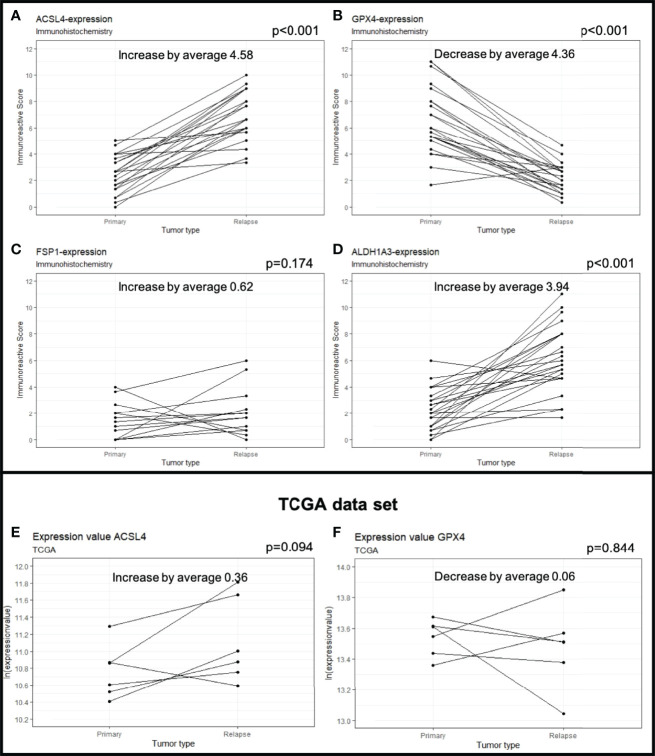
Figure 2.
Protein expression in primary and recurrent GBM. The dots mark the level of IRS in the primary and relapse tumor. Each line represents the change in expression of one patient, showing increase of expression for ACSL4 (A), FSP1 (C) and ALDH1A3 (D). GPX4 expression decreases significantly in 23 out of 24 patients (B). The results were verified by analyses of the TCGA data set showing an increase in ACSL4 expression (E) and a decrease in GPX4 expression (F).

