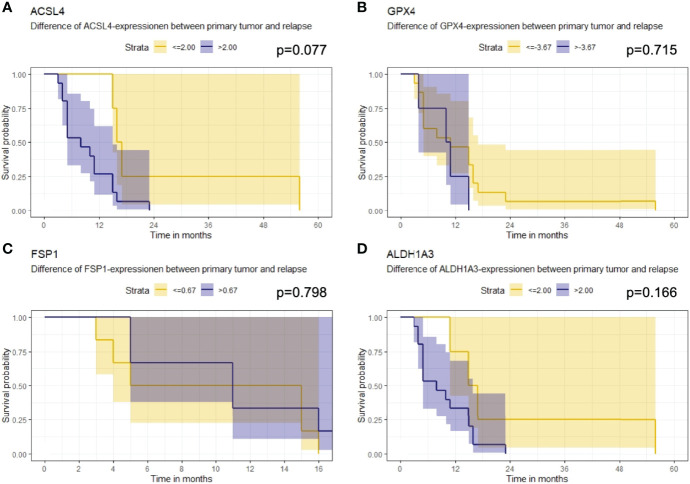
Figure 7.
Kaplan-Meier survival curves. Starting point for measurement of survival time was the time at recurrent confirmation. The p-value describes a possible association between enzyme expression and OS. (A) Patients whose ACSL4 expression increased by more than 2.00 IRS points had a worse outcome, although. (B) GPX4 cutpoint is at -3.67. Patients with a higher pronounced decrease in GPX4 expression had a slightly better outcome. (C) FSP1 cutpoint is at 0.67. There is no relevant association. (D) ALDH1A3 cutpoint is at 2.00. Patients with a higher increase had a worse outcome.

