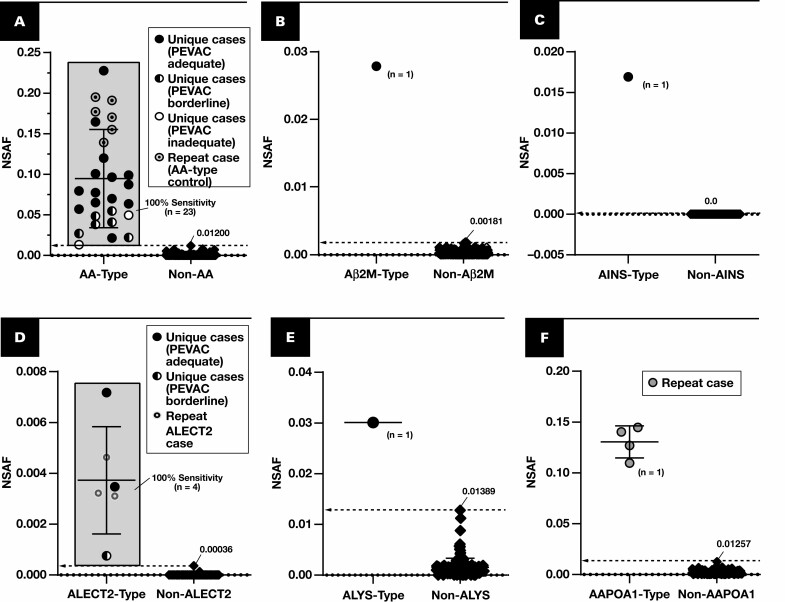
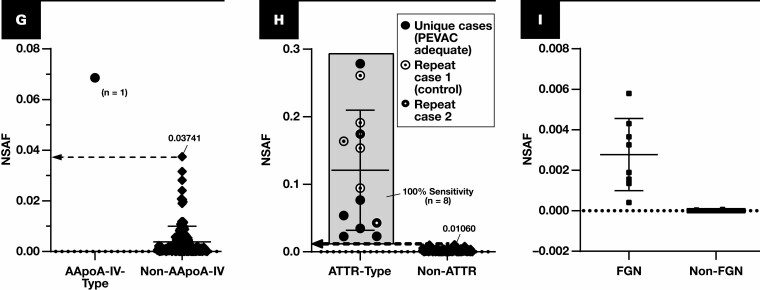
Figure 2.
Spectral abundance of non-AL type-specific proteins. Results are plotted for cases of amyloidosis (circles and diamonds) with at least triplicate analyses (scrapes) per slide. Each point represents the average of normalized spectral abundance factor (NSAF) results from scrapes with PEVAC (serum amyloid P, apolipoprotein E, victronectin, apoliprotein A4, and clusterin) of 2 or more and detection of APOE. Circles represent unique cases unless otherwise indicated in each key (number of unique samples indicated in each plot). Repeat cases typically reflected designated control material, potential control material under evaluation, or cases for amyloid types of which few unique cases were available (eg, ALECT2, AAPOA1). Cutoff points are marked (dotted line), indicating a 100% specificity (and 100% sensitivity) level when comparing with other forms of amyloidosis, including the AL forms. A, Serum amyloid A-1 (SAA1) (P0DJI8) as a marker for AA type. B, β2-Microglobulin (B2MG) (P61769) for Aβ2M type. C, Insulin (INS) (P01308) for AINS type. D, Leukocyte cell–derived chemotaxin 2 (LECT2) (O14960) for ALECT2 type. E, Lysozyme C (LYSC) (P61626) for ALYS type. F, Apolipoprotein A-I (APOA1) (P02647). G, APOA4 (P06727), apolipoprotein A-IV. H, TTHY (P02766), transthyretin. I, DnaJ homolog subfamily B member 9 (DNJAB9) (Q9UBS3) for cases of fibrillary glomerulonephritis (FGN, squares). Because FGN is not a form of amyloidosis, PEVAC scores were not considered when computing average NSAF for DNJAB9. UniProt entry IDs are indicated in parentheses.


