
FIGURE 3.
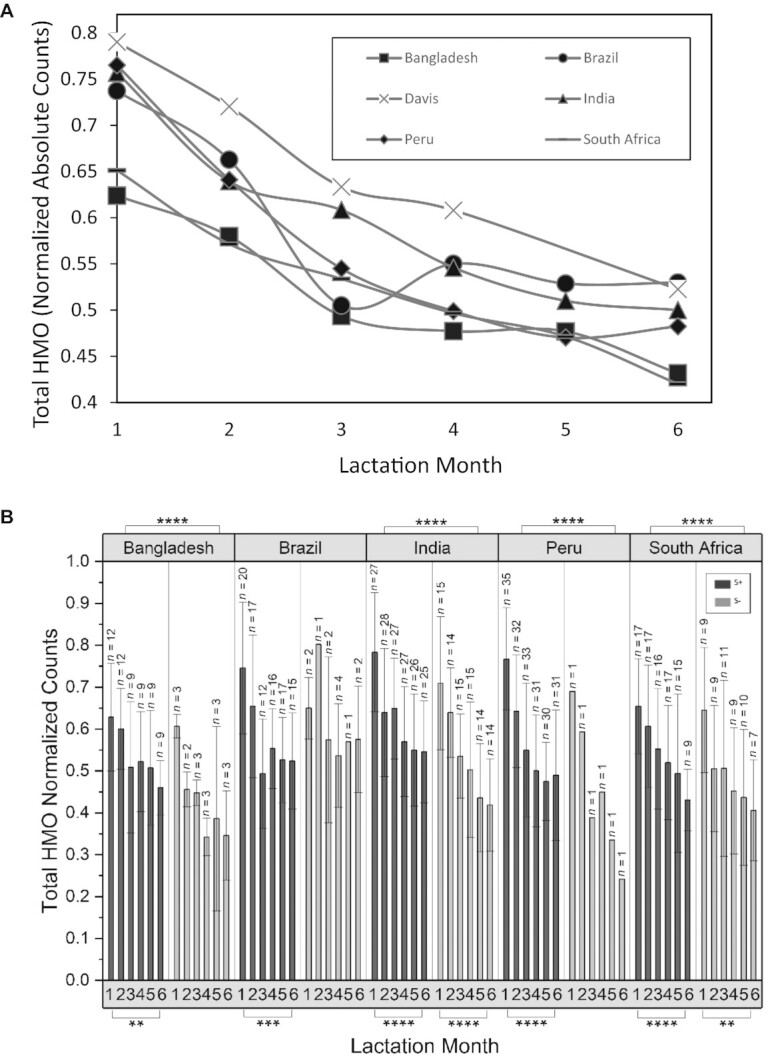
(A) Mean changes in HMO concentrations in breastmilk samples collected monthly during the first 6 months postpartum at sites with extensive longitudinal sampling. (B) Total HMO abundances as a function of location, lactation month, and secretor status. HMO abundance values correspond to HPLC-qTOF MS spectral abundance, normalized to the mean of the total abundance of ion counts from each sample. N values correspond to the number of samples. Error bars represent the SD. P values were obtaining using Mann-Whitney U tests with an α correction of 0.05. HMO, human milk oligosaccharide; qTOF, quadruple time of flight. * P ≤ 0.05, ** P ≤ 0.01, *** P ≤ 0.001, ****P ≤ 0.0001.