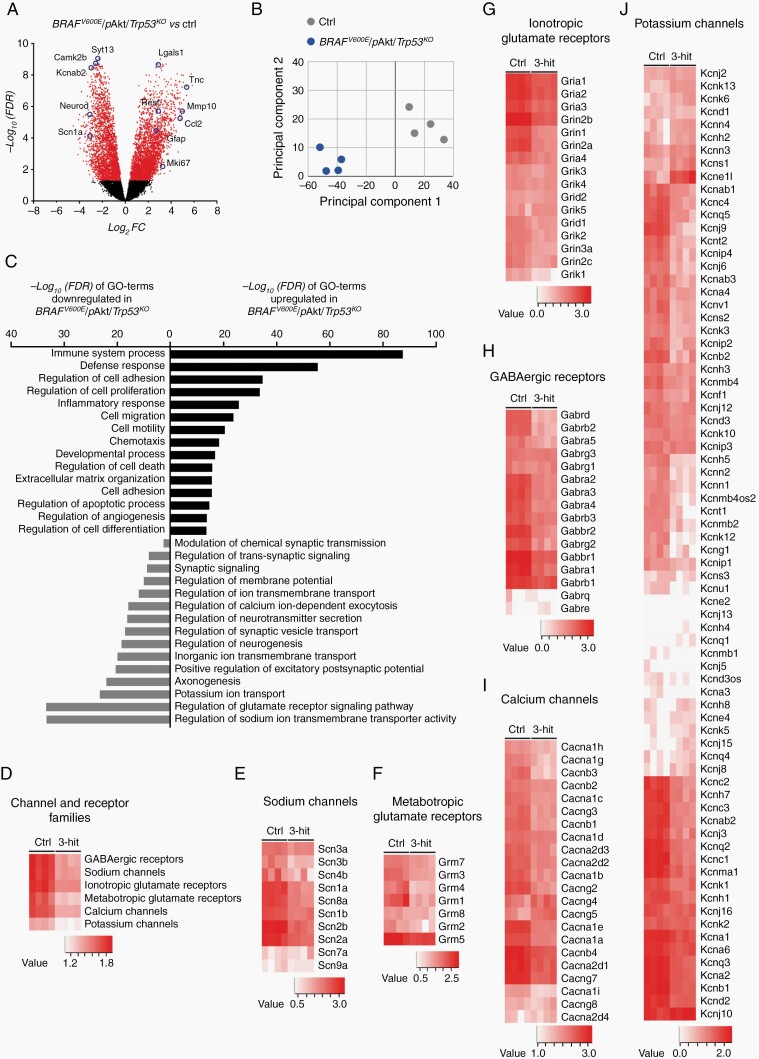
Fig. 5.
Transcriptomic analysis of BRAFV600E/pAkt/Trp53KO-induced tumors reveals malignant glial and non-homeostatic neuronal signatures. (A) Volcano plot represents differentially expressed genes (5842) in 3-hit tumors compared to gray/white matter matched control (ctrl) tissue (n = 4). Each gene is colored based on the −log10 adjusted P-value (false discovery rate [FDR]). Red dots: FDR < 0.05: black dots: FDR > 0.05. (B) PCA plot clearly separates 3-hit tumors (blue dots) from controls (gray dots); transcript signatures of four biological replicates. (C) Gene ontology (GO) terms based on significantly enriched genes from 3-hit tumors compared to control tissue. (D–J) Heatmap visualizations of expression levels of genes coding for synaptic-related channels and receptors. Abbreviations: PCA, principal component analysis.

