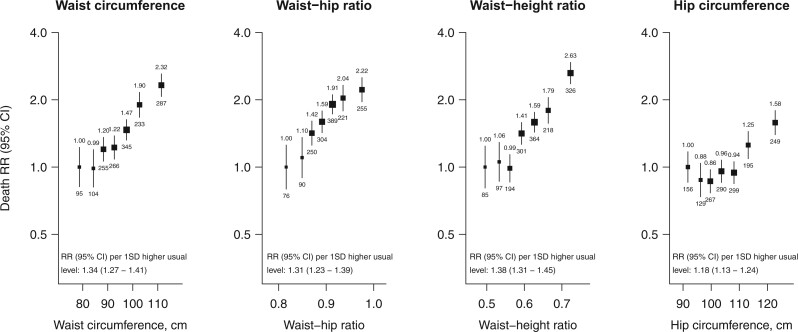
Figure 1.
Adiposity and vascular-metabolic mortality at ages 40–74. Analyses exclude participants with an HbA1c level of ≥6.5% at recruitment, those with diabetes or other chronic diseases (ischaemic heart disease, stroke, chronic kidney disease, cirrhosis, cancer, or emphysema), and all deaths in the first 5 years of follow-up. The seven groups shown correspond to the top and bottom two-tenths and the middle three-fifths of each distribution. The RRs for the seven categories were plotted at the mean usual level in each group, with the vertical lines through each point representing group-specific 95% confidence intervals (with the area of each plotting symbol proportional to the amount of statistical information). RRs were adjusted for age-at-risk, sex, district of residence, self-reported highest level of education attained, leisure-time physical activity status, smoking status, and alcohol intake. The RR is noted above each vertical line and the number of deaths below. The average mortality RR per 1 SD higher usual level (9.9 cm for waist circumference, 8.8 cm for hip circumference, 0.052 for waist–hip ratio, 0.066 for waist–height ratio) is shown throughout the full range studied, and is calculated by performing a weighted regression through the seven log RR estimates (with weights equal to the inverse of the variances of the log RRs). For associations which do not appear to be log-linear, these average RRs may reflect different underlying RRs at different levels of adiposity.

