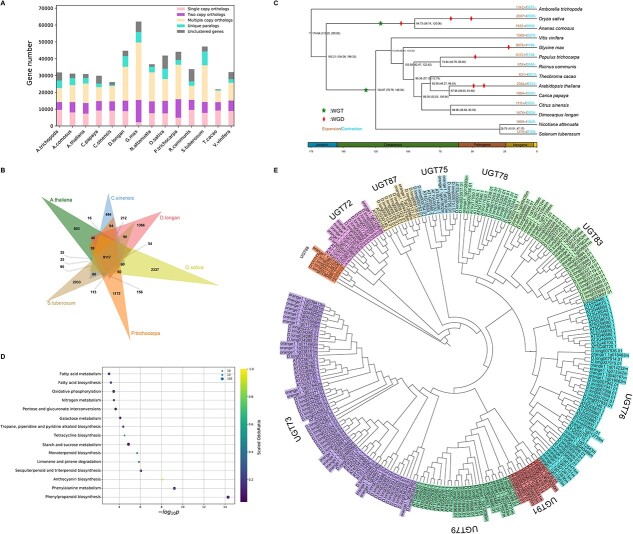
Figure 2.
Phylogenomic genomics of Dimocarpus longan. (A) Summary of gene family clustering of D. longan and 13 related species. Single copy orthologs: 1-copy genes in an ortholog group. Multiple copy orthologs: multiple genes in an ortholog group. Unique orthologs: species-specific genes. Other orthologs: the rest of the clustered genes. Unclustered genes: number of genes outside of cluster. (B) Comparison of orthogroups (gene families) among six angiosperm species, D. longan (longan), A. thaliana (Arabidopsis), C. sinensis (citrus), S. tuberosum (potato), P. trichocarpa (poplar), and O. sativa (rice). (C) Phylogenetic relationships and divergence time estimates (with confidence intervals). The numbers of gene family expansions and contractions are indicated by red and blue numbers, respectively. (D) Bubble plot summarizing the most significantly enriched KEGG terms associated with expanded gene families in D. longan. The x-axis is the log10 transformed p-value. The size of the bubble is scaled to the number of genes. The color scale represents the scale of odds ratio in observed versus expected (genomic background) numbers of genes annotated with specific KEGG terms. (E) A phylogenetic tree of UGTs (UDP-glucosyltransferases) in three angiosperms, including D. longan.

