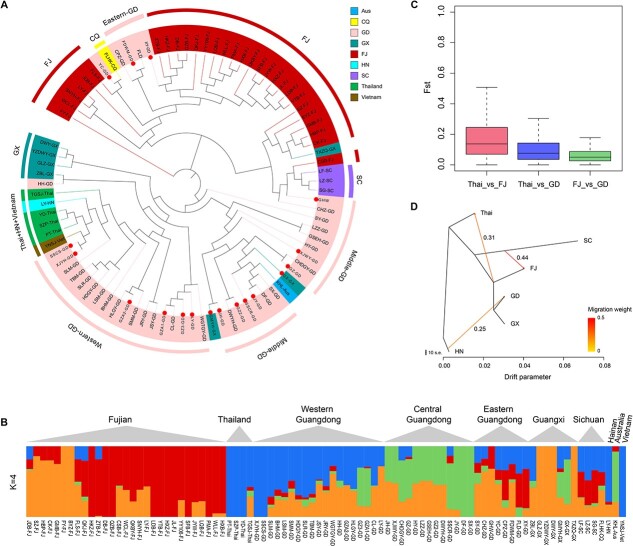
Figure 3.
Population structure and admixture analysis of Dimocarpus longan. (A) A neighbor-joining phylogenetic tree of all D. longan individuals was constructed using SNPs. The artificial breeding individual was marked with red dots inside. Colors represent different geographic groups. (B) A biogeographical ancestry (admixture) analysis of D. longan accessions with four ancestral clusters colored differently in the heatmap, in which each column represents a longan sample. (C) Distribution of Fst values (a measure of genetic differentiation) between longan populations from Thailand (Thai), Fujian (FJ), and Guangdong (GD). (D) Maximum-likelihood tree and migration events among seven groups of D. longan. The migration events are colored according to their weight.

