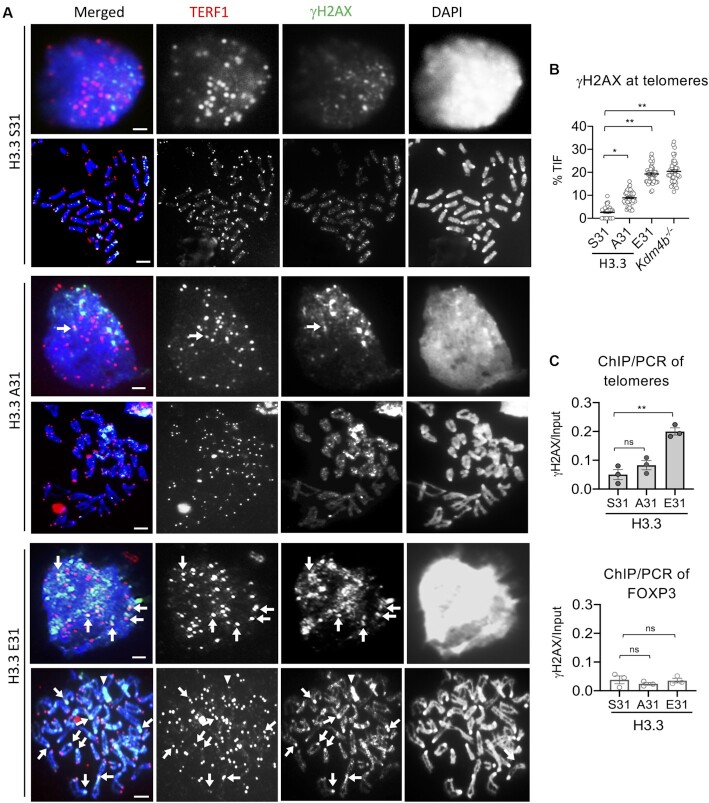
Figure 4.
Increase in γH2AX level at telomeres in H3.3 E31 mouse ES cells. (A) Immunostaining of TERF1 (red; marker for telomere) and γH2AX (green) showing increased γH2AX at telomeres (indicated by arrows) in both interphase and mitotic H3.3 E31 cells. Y chromosomes are indicated by arrowheads. Scale bars: 4 μm. (B) Percentages (mean ± SEM, n = 3, 16 nuclei were analysed in each experiment) of co-localized TERF1/γH2AX foci (TIF) are shown, and increased TIFs are found in H3.3 E31 and Kdm4b–/– cells. (C) ChIP-qPCR analyses (mean ± SEM, n = 3) of γH2AX at telomeres and Foxp3 (a control gene) in H3.3 S31, A31 and E31 mouse ES cell lines. (B, C) P-values calculated using Student's t-test (** P< 0.05; * P< 0.1; ns, non-significant).

