Figure 2.
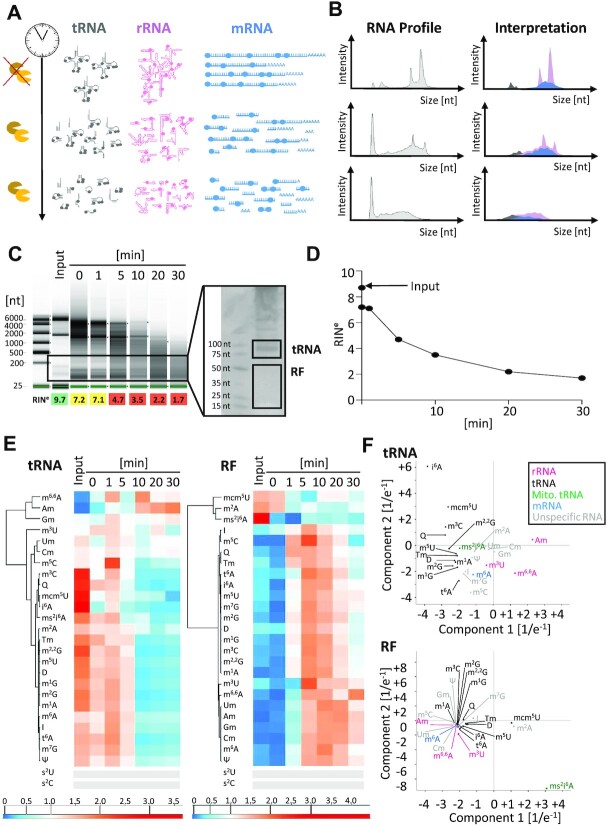
In vitro degradation of total RNA from mouse liver tissue. (A) Schematic representation of RNase-induced time dependent degradation process of the three major RNA classes: tRNA (grey), rRNA (pink) and mRNA (blue) are fragmented over time. (B) Corresponding RNA profiles as obtained by capillary electrophoresis (CE) are shown in grey. The right panel visualizes an interpretation of the redistribution of RNA species and their modifications in the same colors as in (A). (C) CE profiles of total RNA after in vitro degradation at indicated time points. A preparative 10% urea PAGE was used for isolation of RNAs of tRNA or RF size (right panel). (D) Quantification of the decay kinetics as plot of RINe values over time. (E) Heatmaps of tRNA and RF fractions clustered for modified nucleosides. Each row was normalized by its mean. n = 2 technical replicates for RF-fraction, n = 3 technical replicates for tRNA. (F) Principal component analyses of tRNA and RF samples from (E) modifications with signals below 5× S/N across all samples are represented by grey bars.

