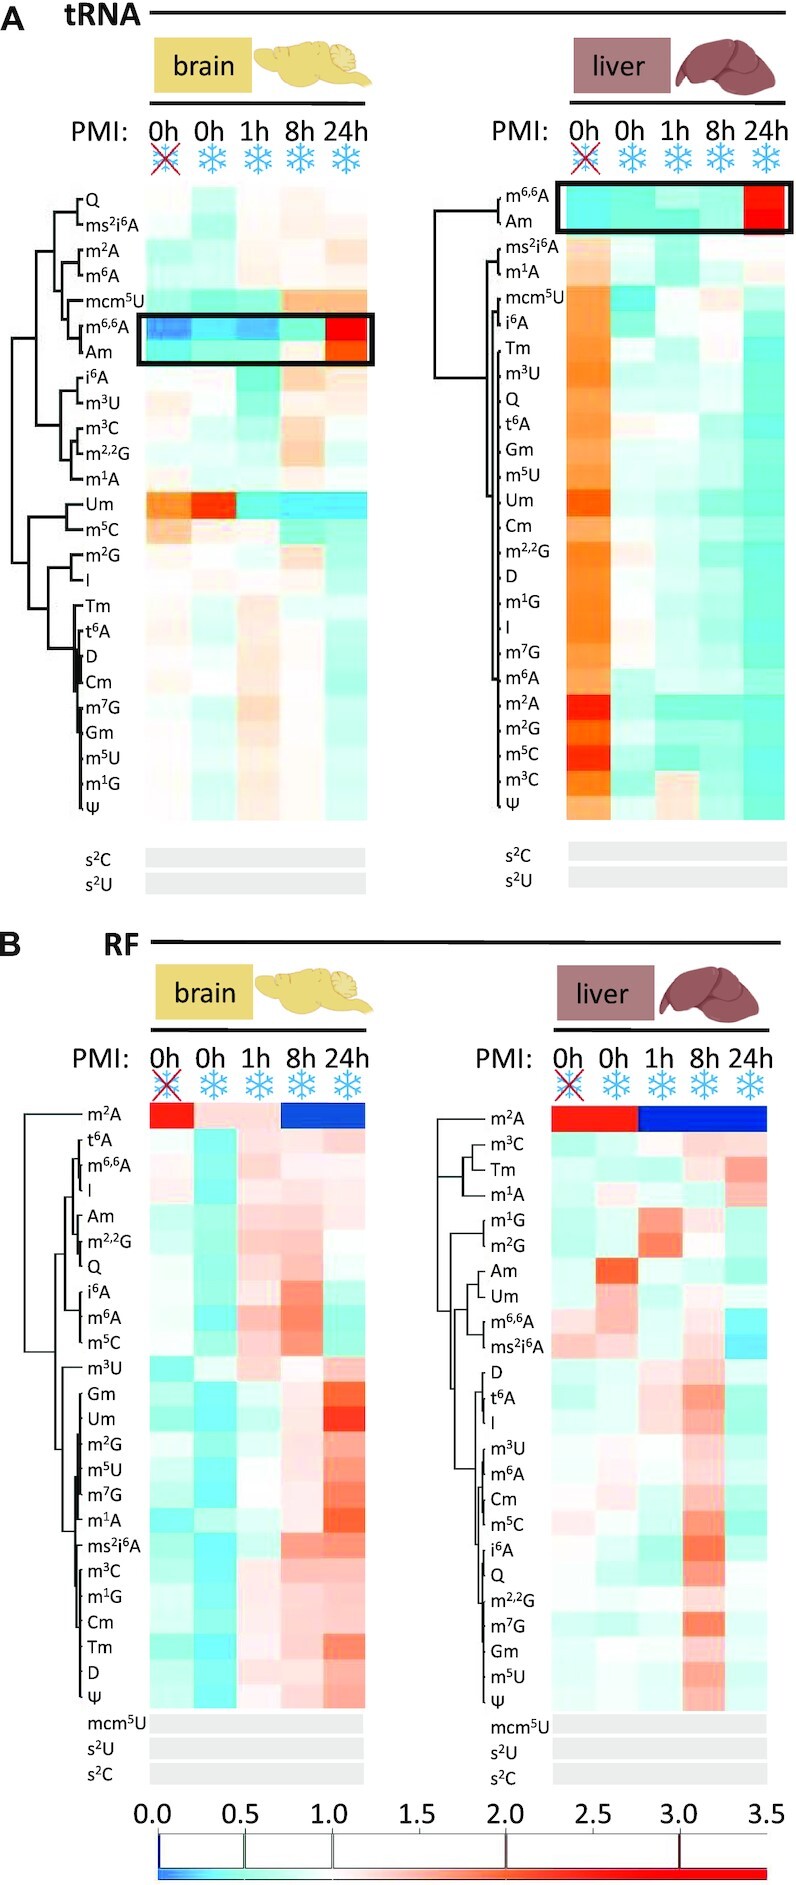
Figure 4.

Comparison of modification profiles in tRNA and RF upon in cellulo degradation post-mortem. (A) Heatmaps represent modification content of tRNA-fractions from mouse brain and liver tissue isolated at different time points post mortem and in comparison with unfrozen samples. Each row was normalized by its mean. n = 4 biological replicates. (B) At different time points post mortem and in comparison with unfrozen samples. Modifications with signals below 5x S/N across all samples are represented by grey bars.
