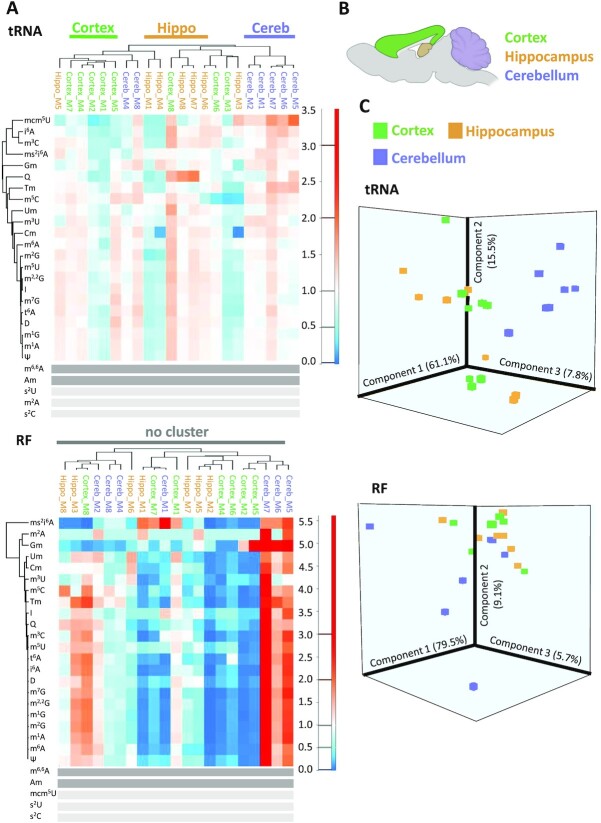
Figure 5.
Comparison of different mouse brain tissues (cohort 1). (A) Heatmap displaying tRNA and RF modification content of different brain areas. From n = 16 mice, the material of two mice were pooled, resulting in 8 biological replicates. (B) Sketch of localization of cortex, hippocampus and cerebellum in a mouse brain sagittal cut. (C) Principal component analysis of brain area samples from (B). rRNA modifications in dark grey were omitted from the analysis. Modifications with signals below 5× S/N across all samples are represented by light grey bars.

