
Fig. 4.
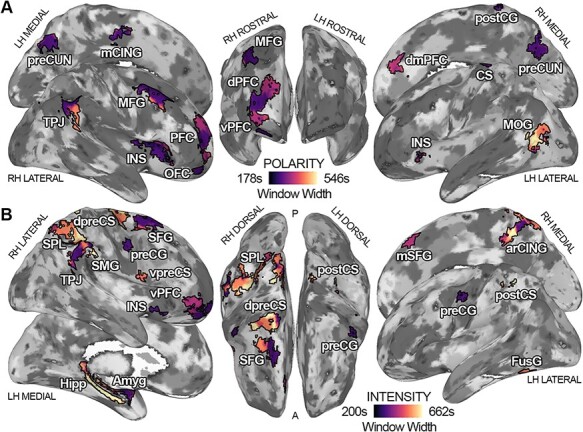
The timescale at which connectivity dynamics is maximally associated with changes in polarity (panel A) and intensity (panel B) for each brain region. Dark purple indicates a preference for shorter timescales (∼178 s for polarity and ∼200 s for intensity), whereas bright yellow signals a preference for the mapping of affect in longer intervals (∼546 s for polarity and ∼662 s for intensity). LH = left hemisphere; RH = right hemisphere; Amyg = amygdala; preCUN = precuneus; TPJ = temporoparietal junction; INS = insula; dPFC = dorsal prefrontal cortex; vPFC = ventral prefrontal cortex; SFG = superior frontal gyrus; VentAttn = ventral attention network; Cont = control network; SubCort = subcortical network.