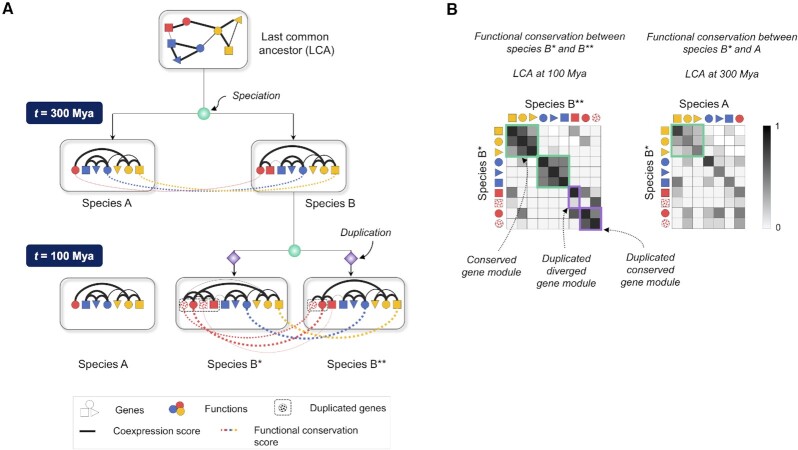
Figure 1.
Schematic to illustrate the variation of functional conservation with phylogenetic distance and lineage-specific gene gains and losses. (A) After the first speciation event, species A loses a gene (red square), while species B* and B** undergo lineage-specific gene duplications (checkered red circles and squares) after the second speciation event. Black lines indicate strength of coexpression between gene pairs within a species, and colored lines indicate the extent of functional conservation between select orthologous genes across species. (B) Heatmaps of functional conservation between every pair of genes in species B* and B** and in species B* and A indicate that functional conservation negatively correlates with phylogenetic distance. Gene modules retaining a single-copy of genes and displaying high coexpression similarity across the species pair are highlighted by green boxes. Duplicated genes are highlighted in purple boxes, and are labeled conserved or diverged based on their coexpression similarity post-duplication.

