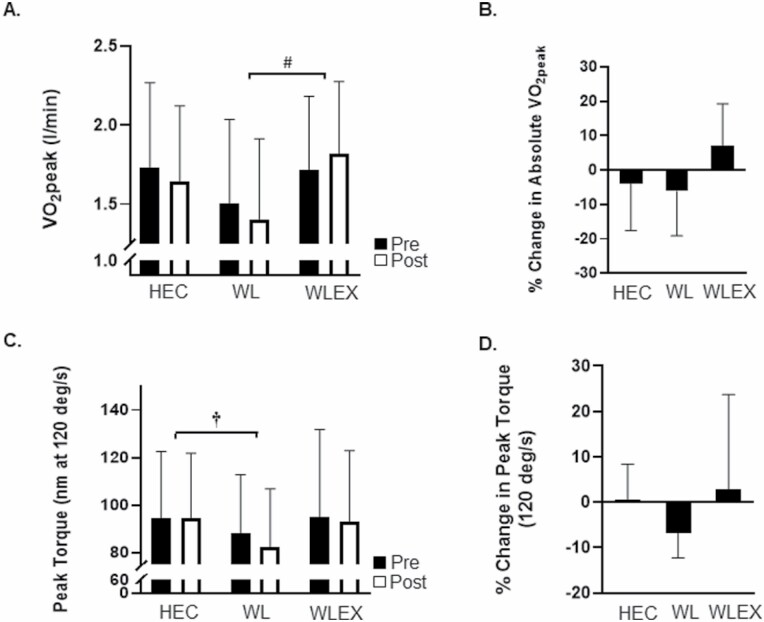
Figure 3.
Between-group changes (mean ± SD) in cardiorespiratory fitness (VO2peak) and muscle strength (peak torque). (A) Pre- and post-values of VO2peak (l/min) by group; #WLEX significantly different than WL at p < .05 (ANCOVA for change in VO2peak followed by pairwise comparisons). (B) Relative (%) change in VO2peak by group. (C) Pre- and post-values of peak torque (measured at 120 degree/s) by group; †WL significantly different than HEC at p < .05 (ANCOVA for change in peak torque followed by pairwise comparisons). (D) Relative (%) change in peak torque by group.

