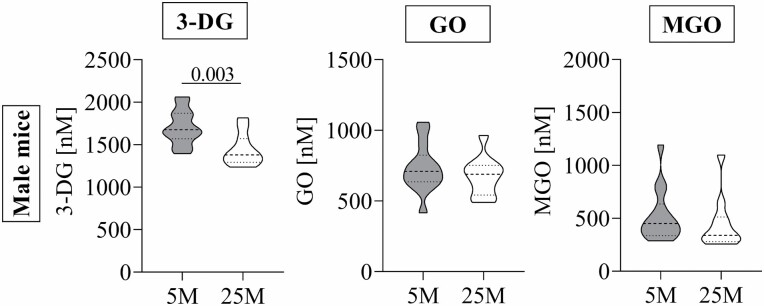
Figure 1.
Postprandial 1,2-dicarbonyl compound concentrations in older (25 months) and younger (5 months) male mice. Data are shown as Violin plots; dotted lines represent median and quartiles. Student’s t-test for normally distributed data and Mann–Whitney U test for nonnormally distributed data were used to assess differences between age groups. 25 months old (n = 11), 5 months old (n = 14). 3-DG = 3-deoxyglucosone; GO = glyoxal; MGO = methylglyoxal; 25 M = 25 months old; 5 M = 5 months old; p < .05.

