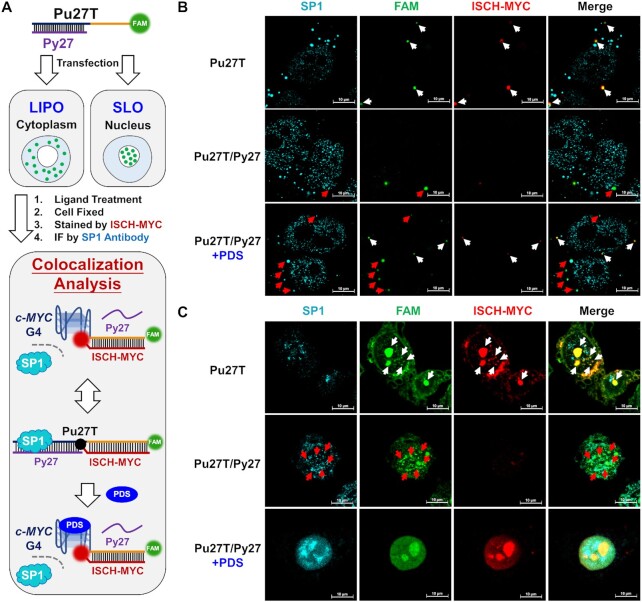
Figure 5.
Visualization of the altered c-MYC DNA-Sp1 interactions. (A) Schematic diagram of cell imaging and analysis process using Lipofectamine 3000 (LIPO) or Streptolysin O (SLO) as transfection reagent. (B) Immunofluorescence imaging of Sp1 in Pu27T or Pu27T/Py27 transfected cells treated with or without PDS then stained by ISCH-MYC. The DNAs are delivered into cytoplasm by Lipofectamine 3000. (C) Immunofluorescence imaging of Sp1 in Pu27T or Pu27T/Py27 transfected cells treated with or without PDS then stained by ISCH-MYC. The DNAs are delivered into nucleus by Streptolysin O. White arrows indicate the distinct colocalization of FAM foci with ‘turn-on’ ISCH-MYC signals; while red arrows indicate the distinct colocalization of FAM foci with Sp1 signals (ISCH-MYC signals were ‘turn-off’ in this case).

