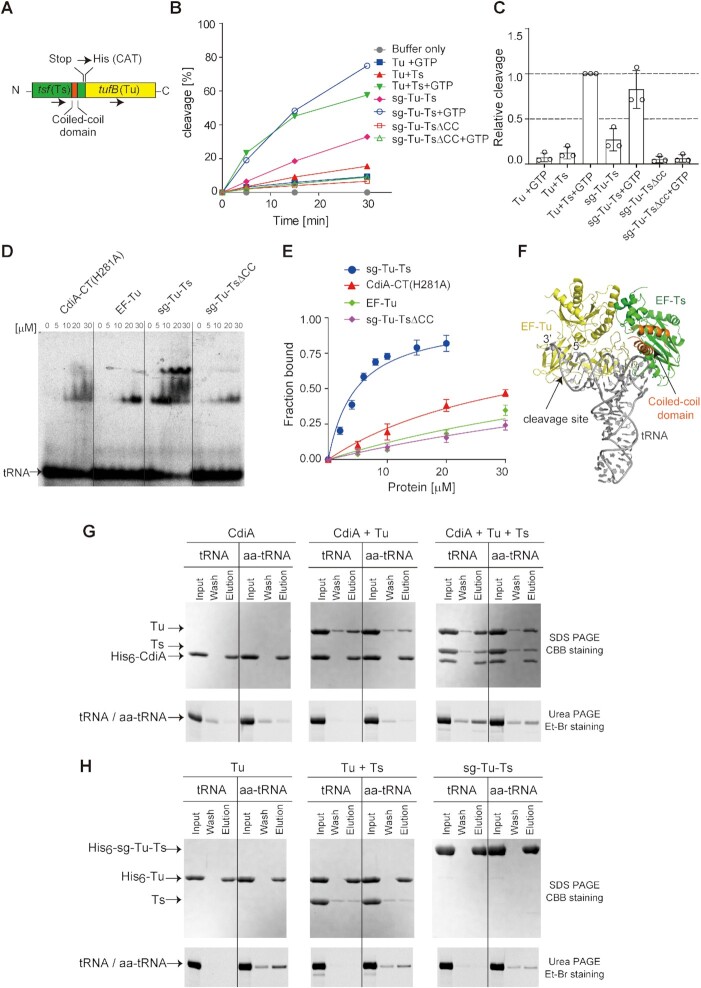
Figure 5.
Formation of CdiA–CT:Tu:Ts:aa-tRNA (tRNA) in the presence of GTP. (A) Schematic diagram of single-chain Tu-Ts (sg–Tu–Ts). The stop codon of Ts gene (tsf) was changed to a histidine codon (CAT), and the Ts gene is followed by Tu (tufB) gene in the same direction. (B) sg–Tu–Ts promotes tRNAGln cleavage by CdiA–CT. tRNAGln (1 μM) was incubated at 37°C with 0.1 μM CdiA–CT in the presence of Tu (0.1 μM), Ts (0.1 μM) or sg–Tu–Ts (0.1 μM) and GTP (1 mM). The fraction of cleaved tRNA was quantified at the indicated time points. (C) Relative tRNAGln cleavage by CdiA–CT at 5 min in the presence of Tu and Ts or sg–Tu–Ts (sg–Tu–Ts_ΔCC) and GTP at 37°C as in (B). The tRNAGln cleavage level by CdiA–CTEC869 in the presence of wild-type Tu, Ts and GTP was defined as 1.0. (D) Gel-shifts of tRNAGln by various amounts of CdiA–CT, Tu, sg–Tu–Ts, and sg–Tu–Ts_ΔCC (0–30 μM). The two complexes observed in the binding of sg–Tu–Ts to tRNA represent alternative binding modes. (E) tRNA fraction bound to each protein in (D). (F) A model of tRNA docking onto the Tu:GDPNP:Ts complex (50). Tu and Ts are colored yellow and green, respectively. The coiled-coil domain of Ts is colored orange and the tRNA is colored gray. The Tu:GTP:aa-tRNA structure (PDB ID: 1OB2) was superimposed onto the structure of Tu:GDPNP:Ts (PDB ID: 4PC7). For clarity, Tu:GTP in Tu:GTP:aa-tRNA is omitted. (G) His-tagged CdiA–CT was mixed with Tu or Tu and Ts in the presence of tRNA or aa-tRNA and GTP, and the mixture was loaded onto Ni-NTA column. The column was washed, and finally, CdiA–CT was eluted from the column. The quaternary complex of CdiA–CT:Tu:Ts:tRNA(aa-tRNA) was formed. Proteins were visualized by SDS PAGE stained with CBB, and tRNA was visualized by PAGE stained with ethidium bromide. (H) His-tagged Tu was mixed with aa-tRNA or tRNA in the absence (left) or presence (middle) of Ts and GTP, and the mixture was loaded onto a Ni-NTA column. The column was washed, and finally, Tu was eluted from the column. His-tagged sg–Tu–Ts was also mixed with aa-tRNA or tRNA in the same manner, and sg–Tu–Ts was eluted from the column (right). Proteins and RNA were visualized as in (G). The error in the graphs in (C) and (E) represent SDs of at least three independent experiments, and data are presented as average values ± SD.

