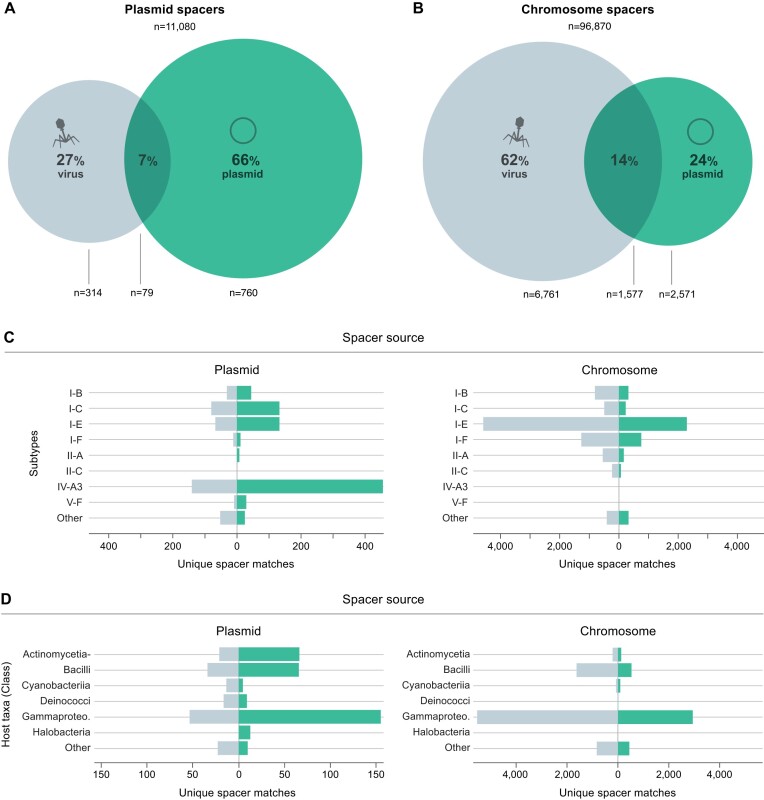
Figure 3.
Analysis of plasmid CRISPR spacer contents reveals a plasmid targeting bias. The proportion of plasmid (A) and plasmid-host (B) chromosomal spacers matching plasmids (green) and viruses (grey). (C) Distribution of spacer-protospacer matches derived from plasmid (left) and plasmid-host chromosome (right) spacer contents, presented according to CRISPR-Cas subtype/variant and predicted spacer target: plasmids (green) and viruses (grey). Only the top 8 subtypes for both plasmids and chromosomes are represented, with the remaining grouped in ‘Other’. (D) Distribution of spacer-protospacer matches derived from plasmid (left) and host chromosome (right) spacer contents, broken down by host taxa and predicted protospacer origin: plasmids (green) and viruses (grey). Only the top 6 classes for both plasmids and chromosomes are represented, with the remaining classes grouped in ‘Other’.

