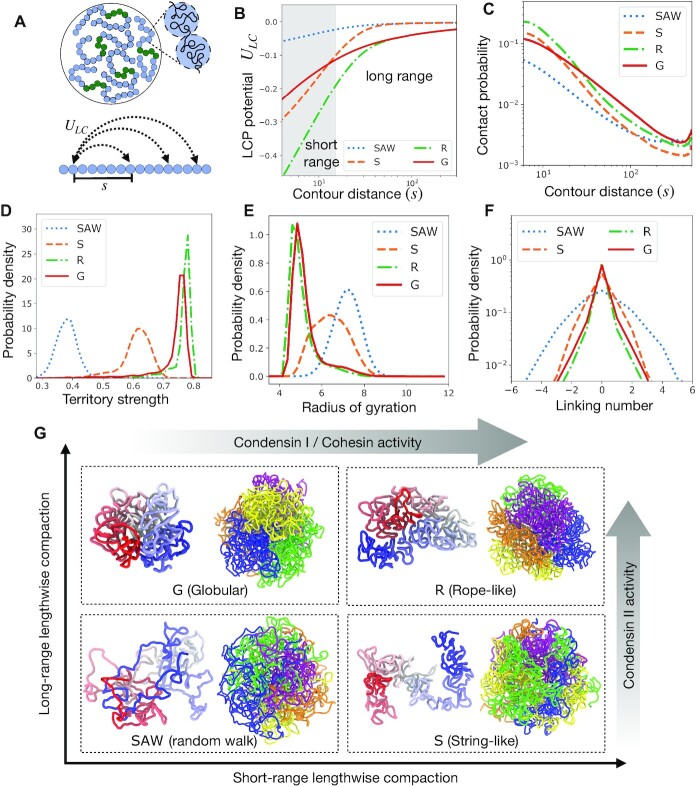
Figure 1.
Regulation of chromosome structure and entanglements via lengthwise compaction. (A) Schematic of simulation set up. Five chromosomes, each constituted of an array of 500 monomers, are simulated, where the central regions shown in green are centromeres. (B) Lengthwise compaction potential ULC, plotted as a function of the genomic distance s. Note the generic decay with genomic distance, however, the intensity of the potential at long and short ranges are distinct for the different phenotypes: Random walk-like (SAW), Globular (G), Stringy (S), and Rope-like (R). (C) Probability of contact between loci pairs that are s distance apart along the contour, plotted as a function of s. The distributions of (D) the chromosome territory strength, defined as the ratio of intra-chromosome to total number of contacts, (E) the radius of gyration, and (F) inter-chromosome Gauss linking number, are plotted for the different structural variants: SAW, G, S, and R. (G) The quadrants correspond to where the four structural phenotypes arise as we vary short and long-range lengthwise compaction. Within each quadrant, shown are representative snapshots of a chromosome in the left and the genome on the right. The chromosome on the left is colored from blue to white to red from one end to the other. The genome shows five chromosomes in different colors, highlighting the territory strength.

