Figure 1.
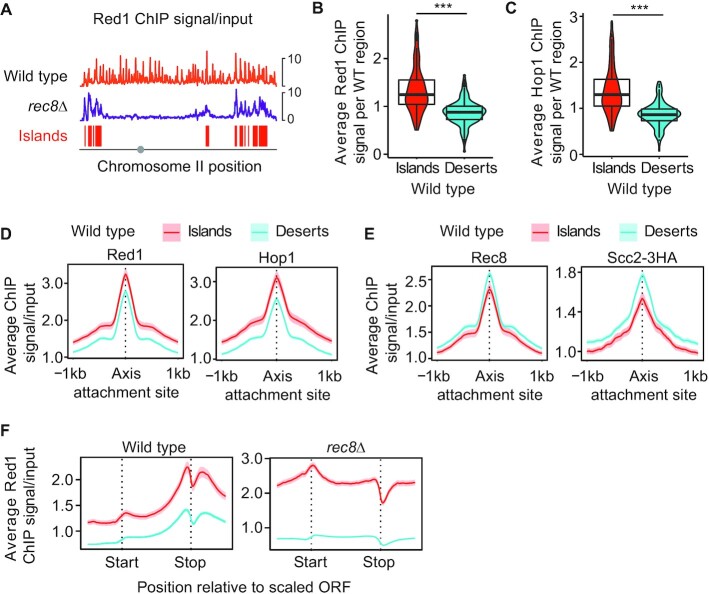
Islands of increased Red1/Hop1 enrichment and decreased cohesin enrichment on wild-type chromosomes. (A) Representative distribution of Red1 in wild-type cells (orange) and rec8Δ mutants (purple) along chromosome II. The distribution of Red1 in rec8Δ mutants was used to parse the genome in islands (red) and deserts (no color; see Methods). Grey circle indicates position of centromere. Note: these profiles are internally normalized, which allows between-sample comparison of binding patterns but not of peak heights. For spike-in normalized profiles of Red1 and Hop1, see Figures 6C and S6A. (B, C) Violin and box plots quantifying the average Red1 and Hop1 signal per island or desert region on wild-type chromosomes. ***P < 0.0001, t-test. (D) Average Red1 and Hop1 enrichment at axis attachment sites (11) in wild type separated into islands and deserts. The 95% confidence interval (C.I.) for the average lines is shown. (E) Average Rec8 and Scc2-3HA enrichment and 95% C.I. at axis attachment sites in wild type. (F) Metagene analysis of Red1 in wild type and rec8Δ mutants indicating average ChIP-seq enrichment along genes in islands and deserts.

