Figure 4.
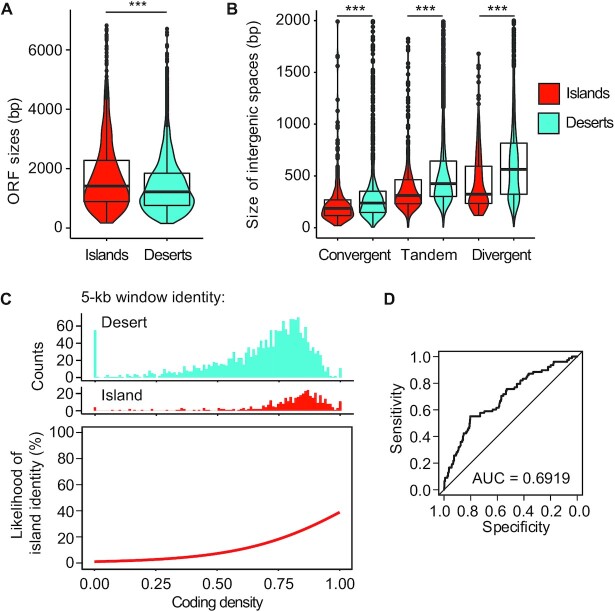
Islands are partially predicted by coding density. (A) Distribution of gene sizes in islands (red) and deserts (blue) displayed in violin and box plots. ***P < 0.0001, Mann–Whitney-Wilcoxon test. (B) Size distribution of convergent, tandem, and divergent intergenic regions in islands and deserts. ***P < 0.0001, Mann–Whitney-Wilcoxon test. (C) Top: non-overlapping 5-kb genomic windows were assigned island or desert identity (see Materials and Methods) and the coding density of each window was calculated. Coding densities range from 0 (all base pairs in the window are intergenic sequence) to 1 (all base pairs overlap with annotated ORFs). Top: histograms showing the number of windows with island or desert identity as a function of coding density. Bottom: Fitted curve for the data shown on top. Coding density was chosen as a significant feature in training a logistic regression model (P < 0.0001). (D) ROC curve showing the specificity versus sensitivity after training a model using 80% of the data to predict axis and desert identity in the remaining 20% of the data. AUC = area under the curve. Diagonal indicates random association.

