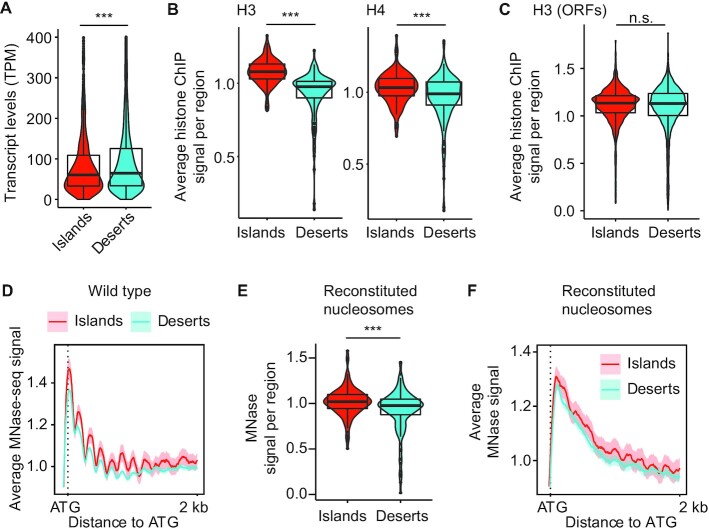
Figure 5.
Islands have increased nucleosome density and order that is encoded in the DNA. (A) Violin and box plots quantifying the level of mRNAs transcribed from genes in islands and deserts 2 h after meiotic induction. ***P < 0.0001, Mann–Whitney–Wilcoxon test. (B) Average histone H3 (34) and H4 (35) ChIP-seq signal per island or desert region on wild-type chromosomes 4 h after meiotic induction. ***P < 0.0001, Mann–Whitney–Wilcoxon. (C) Average histone H3 ChIP-seq signal per ORF in islands and deserts. n.s. – not significant, P= 0.1248. (D) Average MNase signal and 95% C.I. for islands and deserts lined up at the ATG for every gene (12,15). (E) Average MNase-seq signal from nucleosomes assembled on naked S. cerevisiae DNA (38) per island or desert region. ***P < 0.0001, Mann–Whitney–Wilcoxon. (F) Average MNase signal and 95% C.I. for islands and deserts lined up at the ATG for every gene for nucleosomes assembled on naked DNA.

