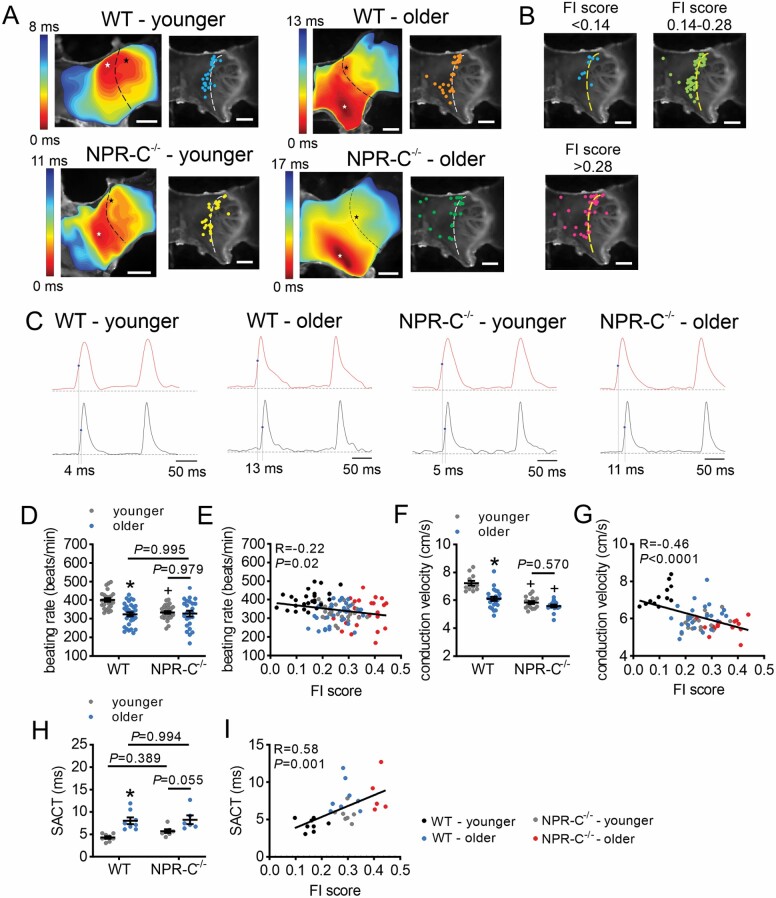
Figure 3.
Effects of age and frailty on sinoatrial node electrical conduction in WT and NPR-C−/− mice. (A) Representative activation maps (left) and leading activation sites (right) in younger and older WT and NPR-C−/− mice. Right atrium is on the right side of the images. Dashed lines indicate crista terminalis. Red color on activation maps indicates the earliest activation time. (B) Leading activation sites as a function of FI score bins. (C) Optical action potentials (OAPs) from the initial activation site (white asterisk on activation map) and the earliest right atrial activation site (black asterisk on activation map) for younger and older WT and NPR-C−/− mice. Values indicated by vertical lines are the sinoatrial node to atrial conduction times (SACT). (D) Beating rate in younger and older WT and NPR-C−/− mice; n = 25 mice for WT younger, 31 for WT older, 29 for NPR-C−/− younger, and 24 for NPR-C−/− older. (E) Beating rate as a function of FI score for younger and older WT and NPR-C−/− mice (same mice as panel D). (F) Conduction velocity in the right atrial posterior wall in younger and older WT and NPR-C−/− mice, n = 12 mice for WT younger, 23 for WT older, 17 for NPR-C−/− younger, and 16 for NPR-C−/− older. (G) Conduction velocity as a function of FI score for younger and older WT and NPR-C−/− mice (same mice as panel F). (H) SACT for younger and older WT and NPR-C−/− mice, n = 8 mice for WT younger, 8 for WT older, 7 for NPR-C−/− younger, and 6 for NPR-C−/− older. (I) SACT as a function of FI score for younger and older WT and NPR-C−/− mice (same mice as panel H). For panels D, F, and H, *p < .05 versus younger, +p < .05 versus wildtype by 2-way analysis of variance with a Tukey post hoc test. NPR-C = natriuretic peptide receptor C.

