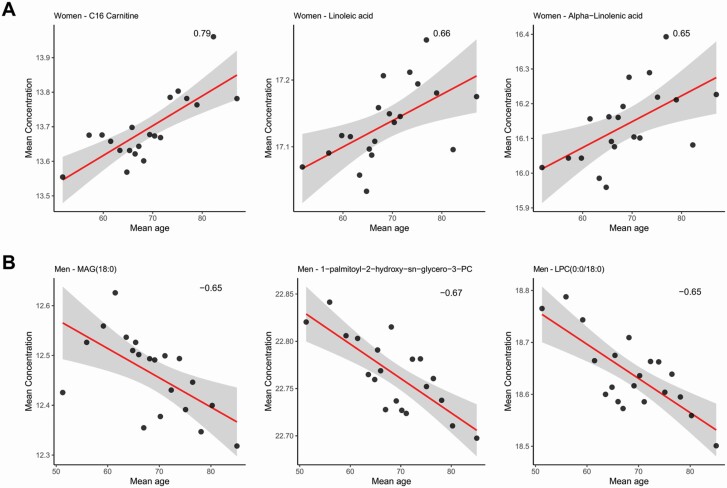
Figure 3.
Correlations between average metabolites and lipids concentrations and the average age of the 20 subject groups: women (A) and men (B). LPC = lysophosphatidylcholine; PC = phosphatidylcholine; PE = phosphatidylethanolamine; MAG = monoacylglycerol. See Figure 2 for an overview of the statistical procedure.

