Figure 3.
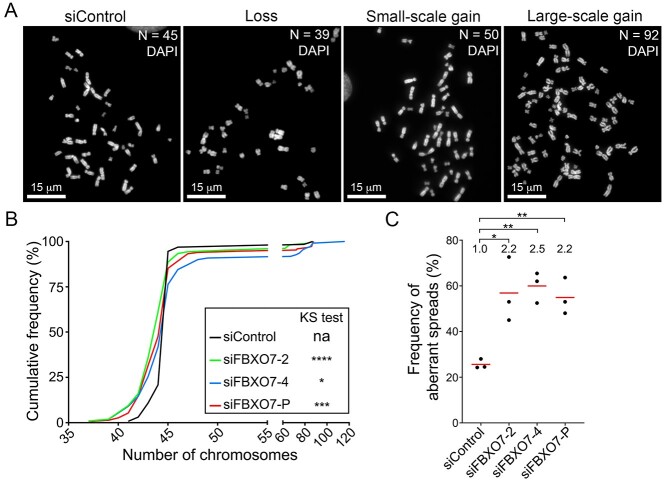
Reduced FBXO7 expression corresponds with increases in aberrant chromosome numbers in HCT116 cells. (A) Representative high-resolution images of DAPI-counterstained mitotic chromosome spreads displaying the modal number of 45 chromosomes (siControl), loss (<45), small-scale gain (46–59) and large-scale gain (≥60) in HCT116 cells. Chromosome numbers (N) within each spread are indicated in the top right corner. (B) Cumulative chromosome number distribution graph reveals significant differences following FBXO7 silencing relative to siControl (two-sample KS test; na, not applicable; *P-value ≤ 0.05; ***P-value < 0.001; ****P-value < 0.0001). (N = 3, n > 100 spreads/condition). (C) Dot plot presenting the frequencies of chromosome spreads with aberrant chromosome numbers following FBXO7 silencing. The fold increase relative to siControl is indicated at the top of each column with mean values identified by the red bar and the statistical analyses as indicated (Student’s t-test; *P-value ≤ 0.05; **P-value < 0.01; N = 3, n > 100 spreads/condition).

