Figure 4.

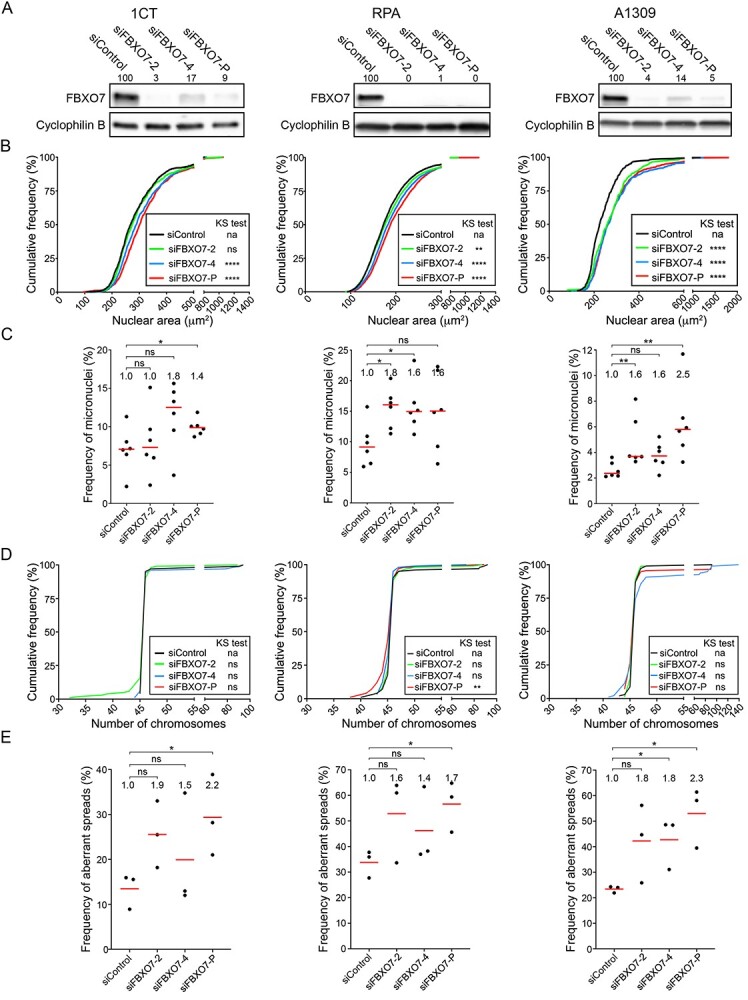
FBXO7 silencing in 1CT, RPA and A1309 cells corresponds with increases in CIN-associated phenotypes. (A) Semi-quantitative western blots showing reduced FBXO7 expression following silencing in 1CT (left), RPA (middle) and A1309 (right) cells. Cells were treated with individual (siFBXO7-2, -4) and pooled (siFBXO7-P) siRNA duplexes. FBXO7 expression is normalized to the corresponding loading control (Cyclophilin B) and is presented relative to siControl. (B) Nuclear area frequency distributions following FBXO7 silencing relative to siControl in 1CT (left), RPA (middle) and A1309 (right) cells. Two-sample KS tests reveal significant or trending increases (i.e. rightward shifts) in distributions relative to siControl (na, not applicable; ns, not significant; [P-value > 0.05]; **P-value < 0.01; ****P-value < 0.0001). (C) Dot plots identify trending and significant increases in micronucleus formation following FBXO7 silencing relative to siControl. Red lines identify the median of six replicate cells, with statistical significance as determined by MW tests (ns, not significant; *P-value ≤ 0.05; **P-value < 0.01; N = 3; n = 6). The fold increase in the median frequency of micronuclei relative to siControl is presented at the top of each column. (D) Representative graphs presenting the cumulative chromosome number distribution frequencies following FBXO7 silencing in 1CT, RPA and A1309 cells. Two-sample KS tests reveal that the siFBXO7-P condition induces a significant change in distributions within the RPA and A1309 cells (ns, not significant [P-value > 0.05]; **P-value < 0.01; ****P-value < 0.0001). (E) Dot plots presenting the frequency of abnormal mitotic chromosome spreads (N ≠ 46 chromosomes) following FBXO7 silencing relative to siControl. Red bars identify mean values with the mean fold increase in aberrant spreads relative to siControl presented at the top of each column. Student’s t-tests reveal significant increases relative to siControl as indicated (ns not significant [P-value > 0.05], *P-value ≤ 0.05; N = 3; n > 100 chromosome spreads/condition).
