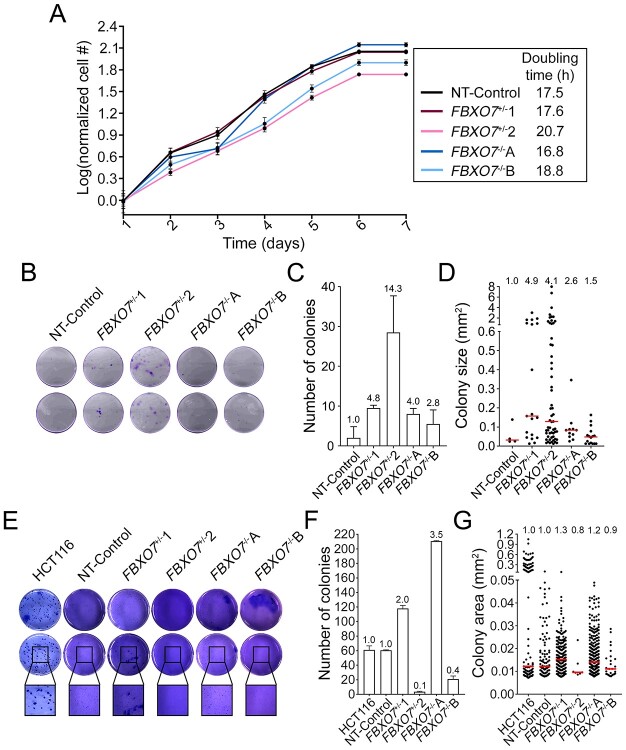
Figure 6.
Reduced FBXO7 expression induces cellular transformation phenotypes. (A) Graph presenting the growth curves from FBXO7+/− and FBXO7−/− clones over 7 days. Cell numbers were normalized to the mean cell number on Day 1 and dots show the mean cell number ± standard deviation (SD). (N = 2, n = 6). (B) Representative low-resolution images of 2D colony formation 2 weeks post-seeding in duplicate wells. Cells were stained with crystal violet for visualization. (C) Bar graph presenting the mean (±SD) number of colonies (≥100 μm in diameter), with the fold increase relative to NT-Control presented above each bar. (D) Dot plot showing increases in colony sizes in FBXO7+/− and FBXO7−/− clones compared with the NT-Control. Fold increases in median values are indicated at the top of each column, whereas the red bars identify median values. (N = 2, n = 2). (E) Representative low-resolution images of 3D colony formation 4 weeks post-seeding in duplicate wells (top and middle rows) in agarose. Cells were fixed and stained with crystal violet for visualization. Black bounding boxes highlight magnified regions (bottom row). (F) Bar graph presenting the mean (±SD) number of colonies. The fold increases in mean colony number relative to NT-Control are presented above each bar. (G) Dot plot presenting increases in colony sizes in FBXO7+/− and FBXO7−/− clones compared with NT-Control. Fold increases in median sizes are indicated at the top of each column, whereas the red bars identify median values. (N = 2, n = 2).

