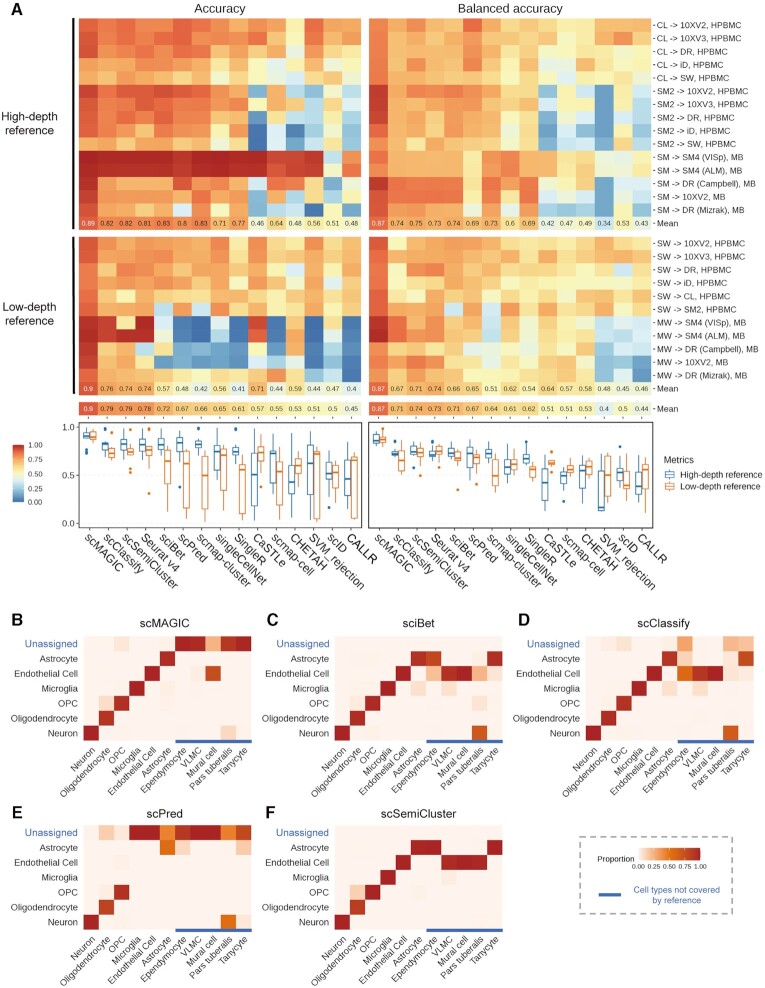
Figure 3.
The performance of scMAGIC and 13 competing methods in the second situation. Panel (A) is organized in the same way as Figure 2 except that the two scenarios are the high-depth and the low-depth reference scenarios, respectively. Here, a benchmark test is represented by the platforms of the reference and the query dataset and the tissue of the two studies. For details about the datasets used in this situation, refer to Supplementary Table S1. Panels (B–F) show the heatmaps of the confusion matrix of scMAGIC, sciBet, scClassify, scPred and scSemiCluster, respectively, in the high-depth reference scenario, with the mouse datasets profiled by SMARTer and Drop-seq (Campbell) as the reference and query dataset respectively. In a confusion matrix, the row and column names correspond to the reference cell labels (including the ‘unassigned’ label) and the query cell labels, respectively, while the element represents the proportion of a specific type of query cells that are assigned with a specific reference cell label; HPBMC, human peripheral blood mononuclear cells; MB, mouse brain; OPC, oligodendrocyte precursor cell; VLMC, vascular and leptomeningeal cell. The abbreviations of the platforms are the same as in Figure 2.

