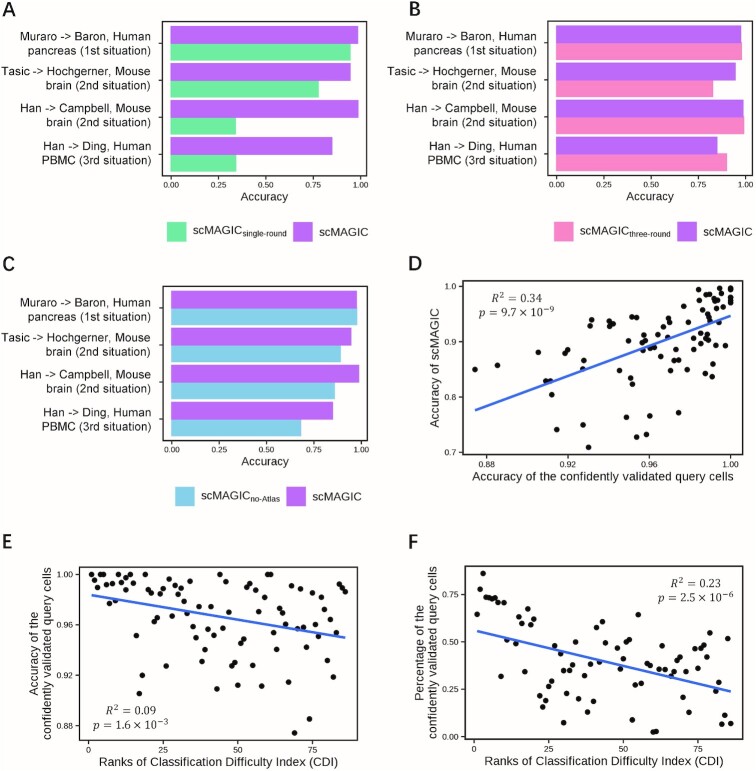
Figure 6.
The analysis for scMAGIC’s algorithm designs. Panel (A) shows the bar plot of the accuracy of scMAGIC and scMAGICsingle-round in four selected benchmark tests. Each benchmark test is represented by the first authors of the reference and the query dataset and the tissue of the query dataset, with the corresponding situation shown in parenthesis. In scMAGICsingle-round, only one round of RBC is performed. Panel (B) is similar to (A) except that scMAGIC is compared with scMAGICthree-round in which three rounds of RBC are performed. Panel (C) is similar to (A) except that scMAGIC is compared with scMAGICno-Atlas in which no atlas expression matrix is included. Panel (D) shows the relationship between the accuracy of scMAGIC and the accuracy of the confidently validated query cells in the first-round of RBC. Panel (E) shows the relationship between the accuracy of the confidently validated query cells and the increase in CDI ranks. Panel (F) shows the relationship between the proportion of the confidently validated query cells and the increase of CDI ranks.

