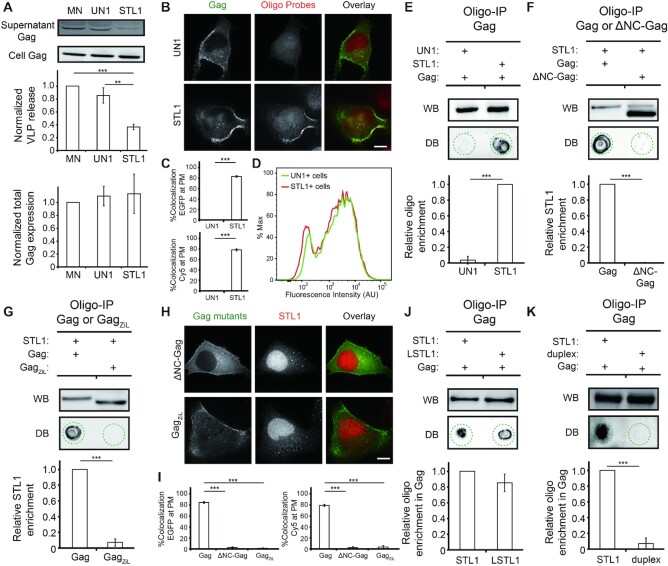
Figure 1.
Gag preferentially interacts with STL1 over UN1 at PM via its nucleocapsid (NC) domain and that the interaction inhibits HIV-1 viral production. (A) Assessment of virus release efficiency and total Gag expression levels by western blot in mock-nucleofected (MN), UN1 + or STL1 + cells expressing Gag (through pNL43ΔPolΔEnv-Gag transfection). Results were normalized to the virus release and total Gag expression levels of MN cells. (B) Representative images of Gag-EGFP (through co-transfection of pNL43ΔPolΔEnv-Gag-EGFP and pNL43ΔPolΔEnv-Gag at a 1:4 ratio) and UN1 or STL1 (tagged with a Cy5 fluorophore at the 5′-end) in UN1 + or STL1 + cells expressing Gag-EGFP. (C) The percentage of EGFP signals that were colocalized with Cy5 signals (%Colocalization EGFP) and the percentage of Cy5 signals that were colocalized with EGFP signals (%Colocalization Cy5) were calculated for cells from (B) on a cell-by-cell basis. (D) Flow cytometric measurements of Cy5 fluorescence in UN1 + or STL1 + cells from (B). The flow cytometry histograms correspond to the Cy5 signal of 10 013 single UN1 + cells (green) and 10 144 single STL1 + cells (red). (E–G) Immunoprecipitation of the oligos in complex with Gag (through pNL43ΔPolΔEnv-Gag transfection) or ΔNC-Gag (pNL43ΔPolΔEnv-ΔNC-Gag transfection), or GagZiL (through pNL43ΔPolΔEnv-GagZiL transfection) in the PM fraction of UN1 + and STL1 + cells (the oligos were tagged with a FAM fluorophore at the 5′-end). Immunoprecipitated Gag or the NC mutant was detected by western blot (WB) and oligos in each immunoprecipitate was detected by dot blot (DB) (see Materials and Methods). Dashed circles indicate the location of the dots. (H) Representative images of STL1 (tagged with a Cy5 fluorophore at the 5′-end) in STL1 + cells expressing ΔNC-Gag-EGFP (through co-transfection of pNL43ΔPolΔEnv-ΔNC-Gag-EGFP and pNL43ΔPolΔEnv-ΔNC-Gag at a 1:4 ratio) or GagZiL-EGFP (through co-transfection of pNL43ΔPolΔEnv-GagZiL-EGFP and pNL43ΔPolΔEnv-GagZiL at a 1:4 ratio). (I) Cell-by-cell analysis of %Colocalization EGFP and %Colocalization Cy5 at the PM of the cells from (H), plotted together with the data acquired for Gag and STL1 at the PM of STL1 + cells as in (C). (J, K) Oligo immunoprecipitation experiments in STL1 + cells, LSTL + cells, and STL1 duplex + cells expressing Gag (through pNL43ΔPolΔEnv-Gag transfection). For (A), (E-G) and (J, K), data represent mean ± SD of three replicate experiments. For (C) and (I), data represent mean ± SEM of at least 15 cells. Scale bar = 10 μm. Asterisks indicate P-values (** P < 0.01, *** P < 0.001).

