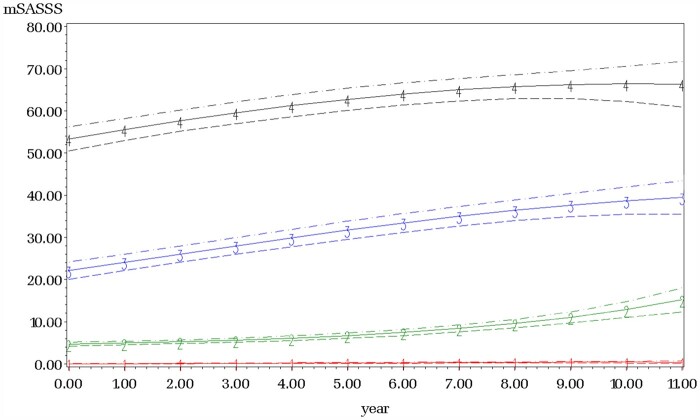
Fig. 2.
Longitudinal mSASSS trajectory groups
Time in years is along the x-axis and total Modified Stokes Ankylosing Spinal Score is along the y-axis. The solid lines represent the estimated mean with dotted lines representing the 95% confidence interval. Trajectory groups from this patient cohort (n =561) are: Group 1 (red line) Non-Progressors, Group 2 (green line) Late Progressors, Group 3 (blue line) Early Progressors and Group 4 (black line) Rapid Progressors. Adjustments included time-variant (TNF inhibitor use and abnormal CRP) and time-invariant risk-factors (e.g. gender, smoking and disease duration).

