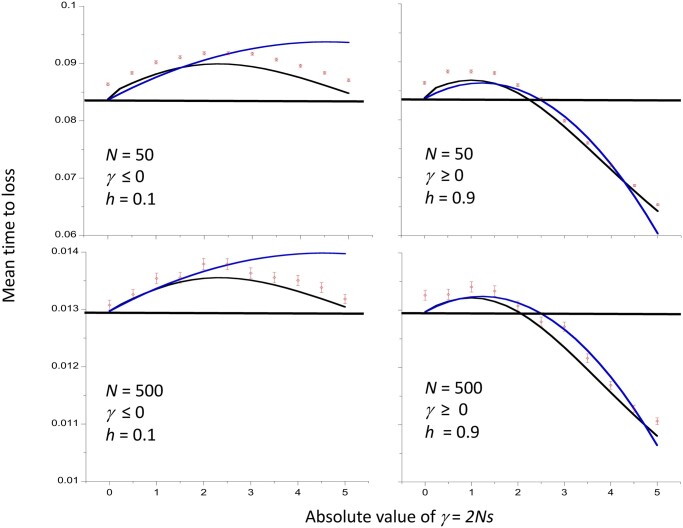
Figure 2.
Mean time to loss of a new mutation as a function of the absolute value of the scaled selection coefficient, assuming autosomal inheritance and a Wright–Fisher model of genetic drift with population size N. Times are in units of coalescent time (2N generations). The cases with negative selection have a dominance coefficient h = 0.1 and those with positive selection have h = 0.9. The results for two different values of the population size, N, are shown. The red points with error bars show the mean values of simulations and their standard errors. The blue curves are the values from the approximation of Equation (3), and the black curves are the values from numerical integrations of the diffusion equation results (Equations A1 and A6). The horizontal lines are the neutral values from the numerical integrations.

