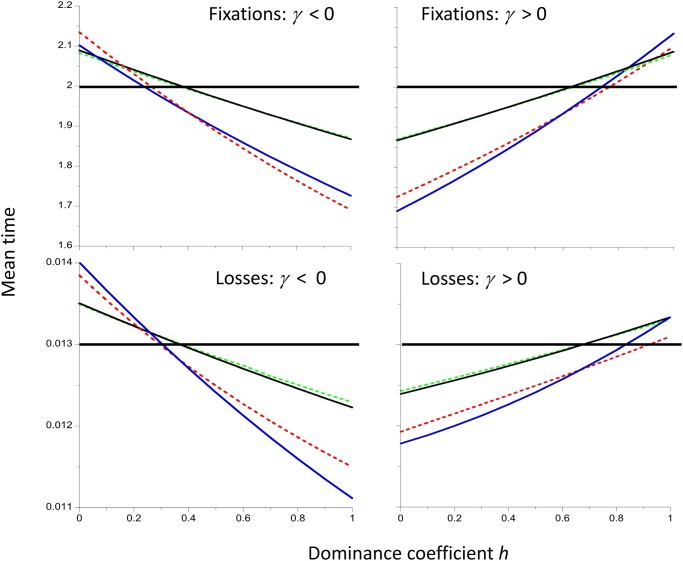
Figure 3.
Mean time to fixation and loss of a new mutation (in units of coalescent time) as a function of the dominance coefficient h, for the models used in Figs. 1 and 2. The black and blue lines use the approximations of Equations (2) and (3) to generate results for |γ| = 1 and 2, respectively. The dashed green and red lines are the corresponding values from numerical integrations of the diffusion equation expressions. The horizontal lines are the neutral values from the numerical integrations. The population size N is equal to 500.

