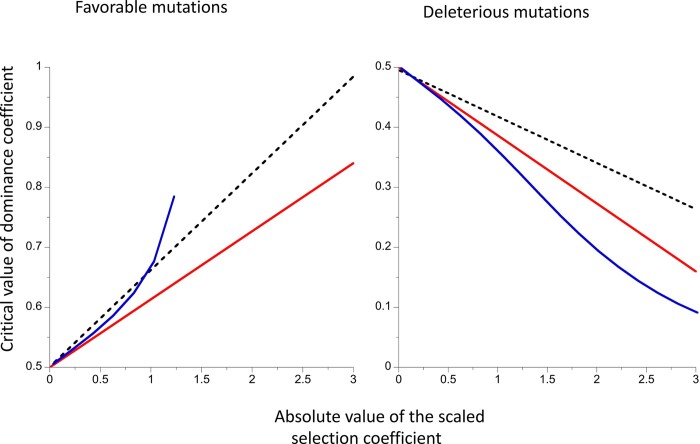
Figure 4.
The critical values of the dominance coefficient as functions of the scaled selection coefficient for mean fixation time (full red line) or mean loss time (dashed black line). The results were obtained using the approximate Equations (8). The blue curves are the solutions to Equation (18) of Zhao and Charlesworth (2016). The results for favorable mutations are shown in the left-hand panel and those for deleterious mutations in the right-hand panel.

