Figure 5.

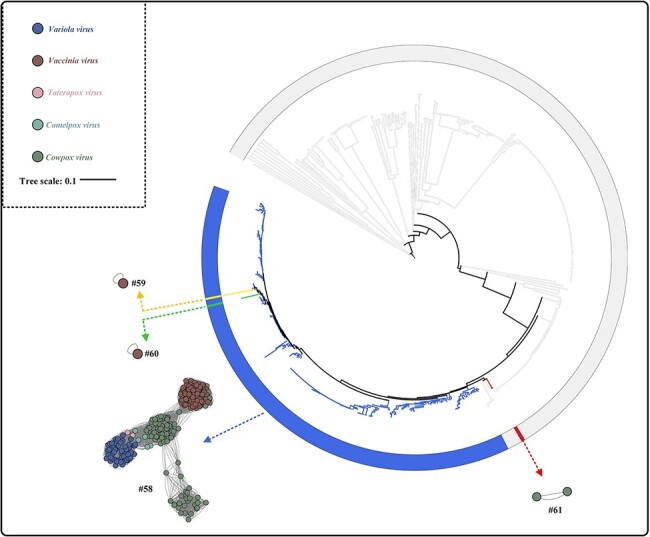
The ViPTree showing the comparison between phylogenetic analysis and ANI analysis within Type III group poxvirus. The different colours represent different clusters for Type III group members.

The ViPTree showing the comparison between phylogenetic analysis and ANI analysis within Type III group poxvirus. The different colours represent different clusters for Type III group members.