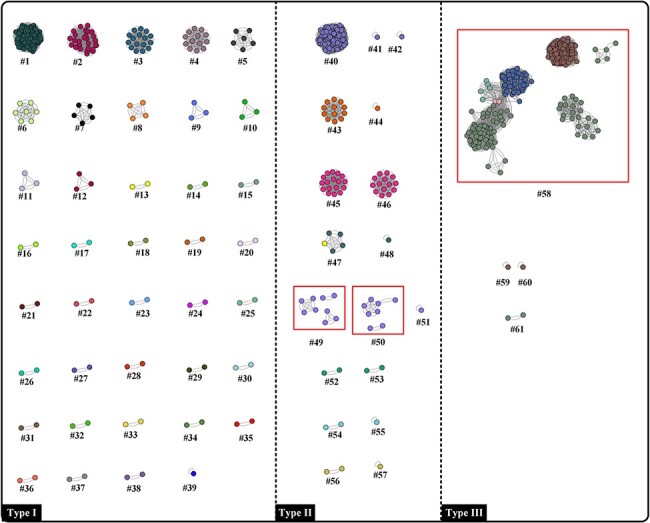
Figure 6.

ANI_BLASTN-based network analysis of 685 poxvirus genomes. Red squares indicate the differences when compared with FastANI. Each dot and colour represent one poxvirus genome and one species, respectively. Dots connected by lines indicate a cluster where the calculated ANI values were over 98 per cent. In the present study, the clusters are defined at ANI species rank and within clusters, each poxvirus has a corresponding member (ANI value ≥ 98 per cent).
