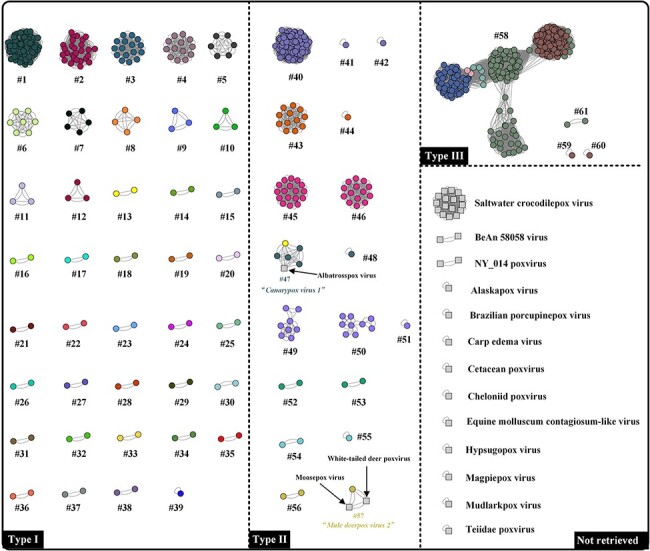
Figure 7.

FastANI-based network analysis of 719 poxvirus genomes. Each dot/square and colour represent one poxvirus genome and one species, respectively; the grey squares indicate poxviruses without official species names. Dots/squares connected by lines indicate a cluster where the calculated ANI values were over 98 per cent. In the present study, the clusters are defined at ANI species rank and within clusters, each poxvirus has a corresponding member (ANI value ≥98 per cent). Not retrieved: viruses not officially named in ICTV.
