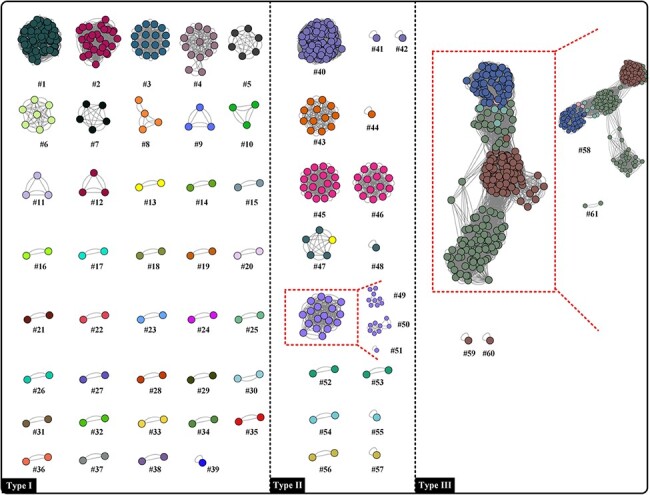
Figure 8.

BLAST-based network analysis depends on 685 concatenated sequences. Each dot and colour represent one poxvirus genome and one species, respectively. Dots connected by lines indicate a cluster where the calculated percentage of identical matches exceeding 99 per cent. Red squares indicate differences when compared with ANI analysis based on whole genome sequence (clusters #49, #50, #51, #58, and #61 were generated by ANI analysis).
